![]()
![]()
![]()
Kangaroo Island Council Project - Kane Hengchuan Zhao
Step by step details for creating maps of community services operating within councils
Intern Kane Hengchuan Zhao has extended his Data Analytics Team project report on SAcommunity listed services operating in the Kangaroo Island council area. Specifically by mapping services in Microsoft Power BI through adding an ArcGIS for Power BI map visualisation, allowing new insights through geospatial data.
Kane has documented these processes as part of capacity building for the Data Analytics Team below:
1.Building a Map for the Council dataset
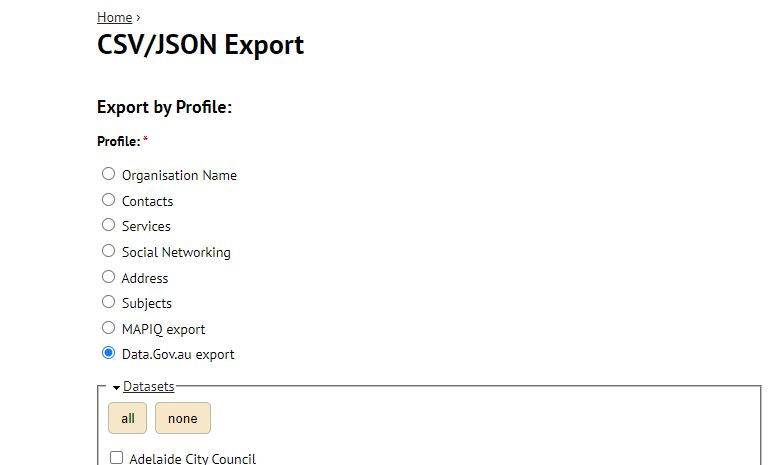
01. Exporting Data
1. Export data from SACommunity export. We need to click 'Data.Gov.au export' and select the council you choose. And then click export in the buttom of the page.
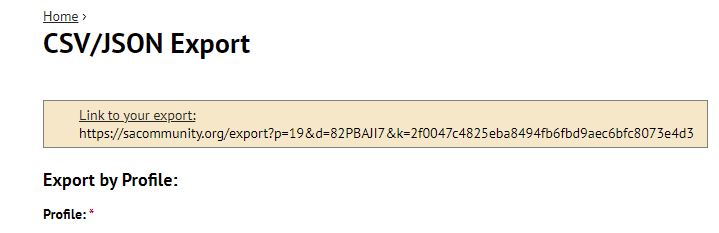
2. We click the export link shown as below and get a csv file which contains the details of organizations in the choosen council.
02. Add Latitude and Longitude
1. Load the data from step 01 and select useful fields.
2. Add address column using the combination of other columns.
3. Use ArcGIS to get latitude and longitude.
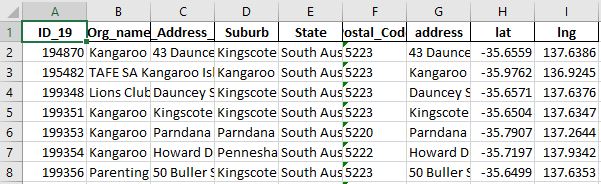
4. Form a new excel file contians organizations and their locations.
The results file is like:
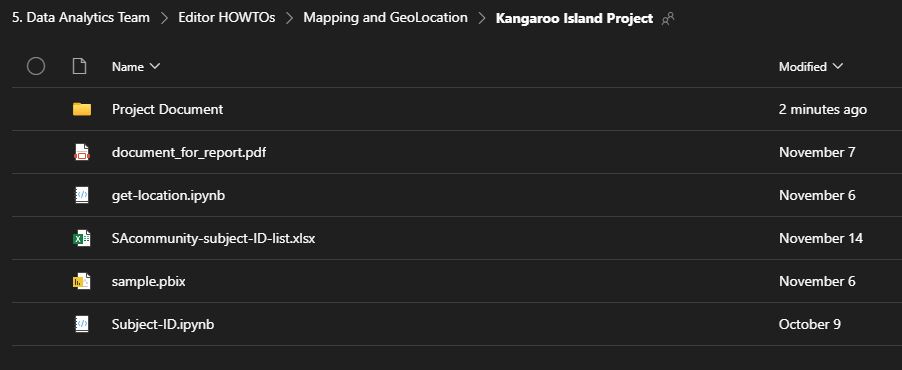
The code and comments can be found in Teams->5.Data Analytics Team->Editor HOWTOs->Mapping and GeoLocation->Kangaroo Island Project->get-location.ipynb.
03. Export Service Data
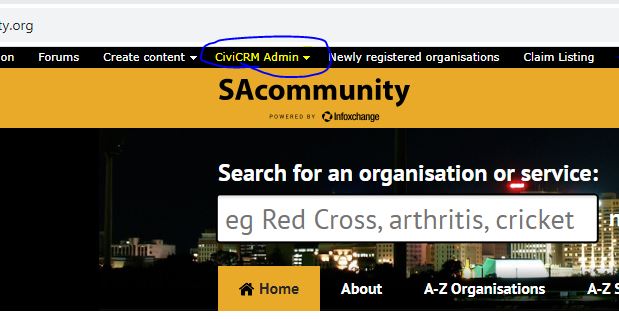
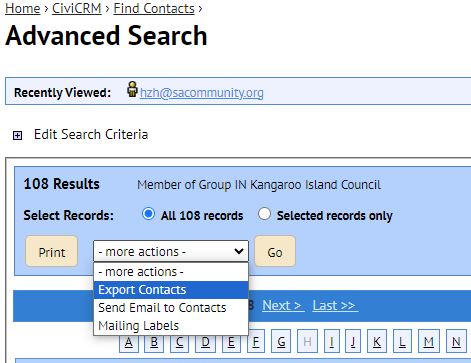
1. Go to SAcommunity, click civiCRM Admin and choose CiviCRM advanced Search or you can just click link.
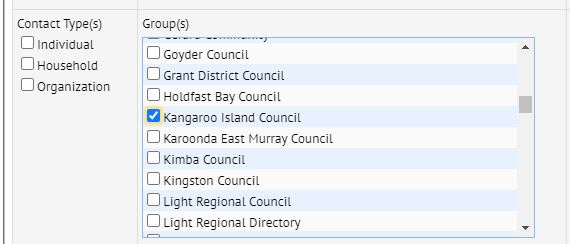
2. Select the council you choose and click search.
3. Select 'All XXX records' and in 'more actions' we choose Export Contract. Then click GO.
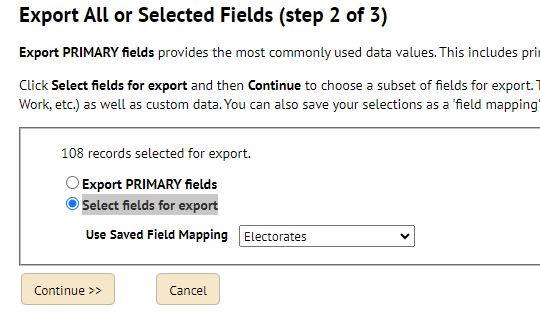
4. Choose 'Select fields for export' and select 'Electorates'. Then click 'Continue'.
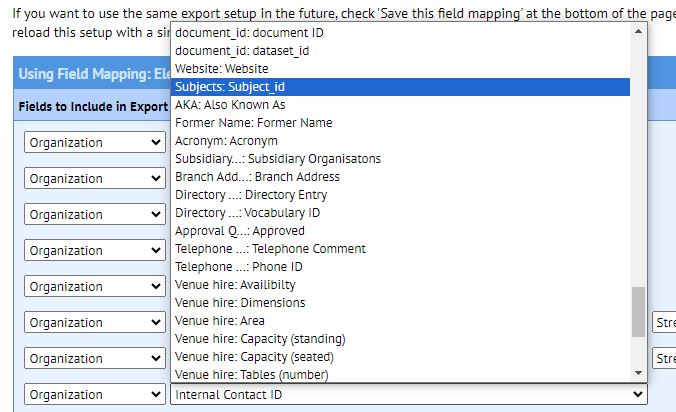
5. Add subject(which is services) record by choosing 'Organization' and 'Subjects:Subject_id'. Then click Export.
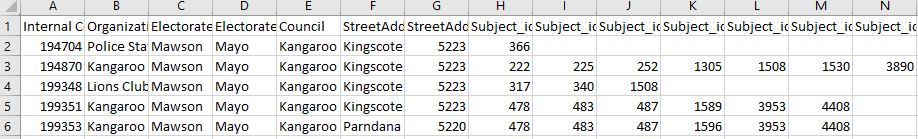
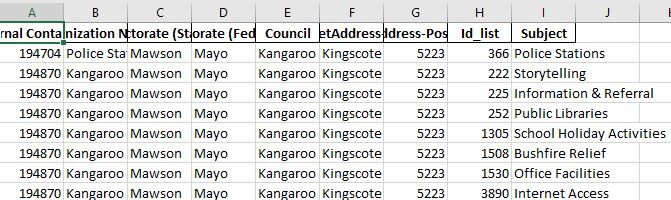
The results file is like:
04. Handle Service Data
1. Load the data from step 03 and get all columns which start with Subject_id.
2. Explode the data and convert columns(Subject_id) into rows.
3. Load excel files which contain subject id and name.
4. Merge data to get names of subject.
5. Form a new excel file contians organizations and their services.
The results file is like:
The code and comments can be found in Teams->5.Data Analytics Team->Editor HOWTOs->Mapping and GeoLocation->Kangaroo Island Project->Subject-ID.ipynb.
05. Build Report in Power BI
1. Upload three files in Power BI:
- file from step 02 -> organisation-latitude-longitude
- file from step 04 -> organisation-services
- Power BI - XXX Council 20xx-20xx Landing Page.xlsx -> organisation-sessions
2. Mange table relationship in model view, the key factor is organization id (its name may differ in different dataset)
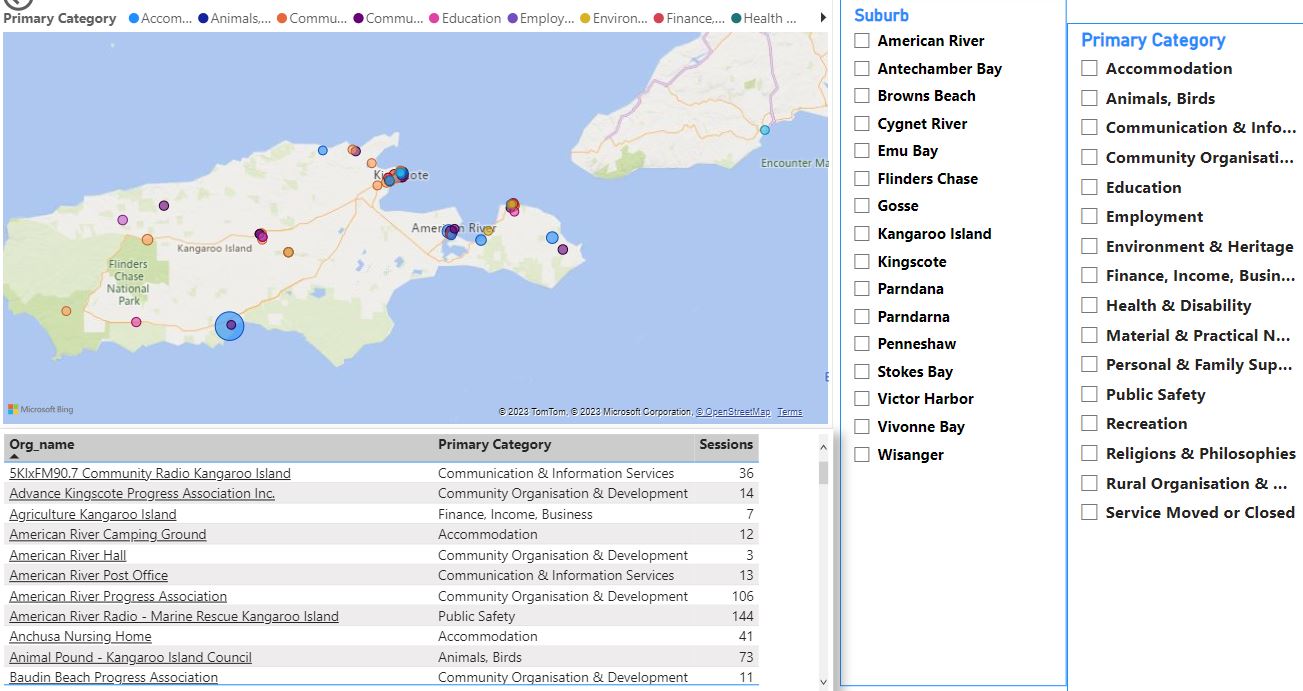
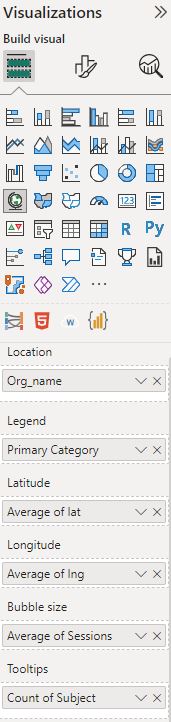
3. Build map in Power BI, detials are as follows:
4. Add hyperlinks to table. We add a new column using
url = "https://sacommunity.org"&'organisation-sessions'[Landing Page]
and set Data category to Web URL. Then we apply settings to org_name column.
The official documents can be reached by Add hyperlinks (URLs) to a table or matrix.
5. Add slicer for suburb and primary category.
The report is like:

The report sample can be found in Teams->5.Data Analytics Team->Editor HOWTOs->Mapping and GeoLocation->Kangaroo Island Project->sample.pbix.
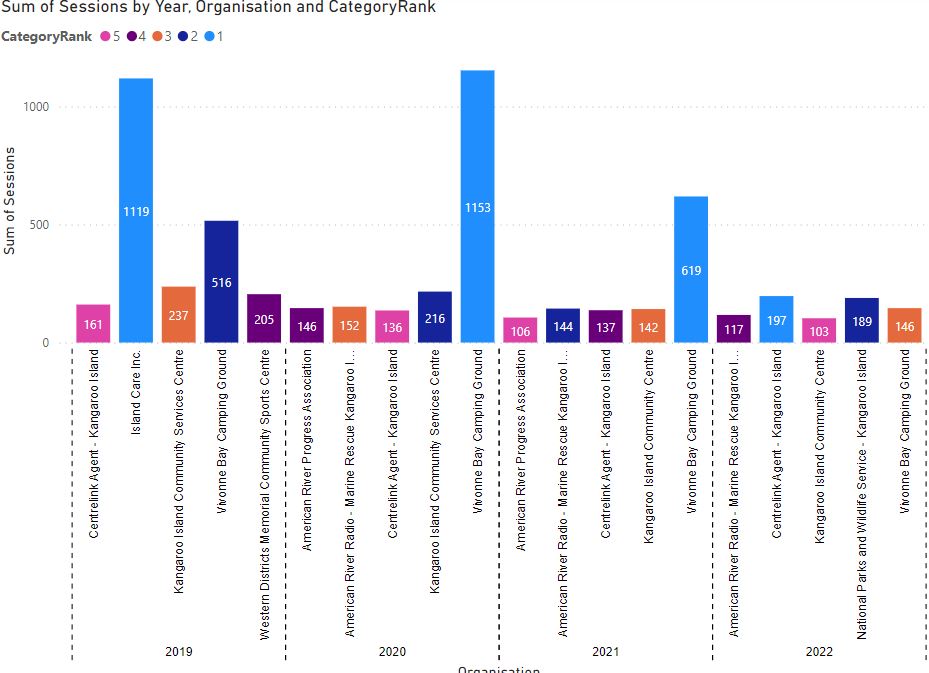
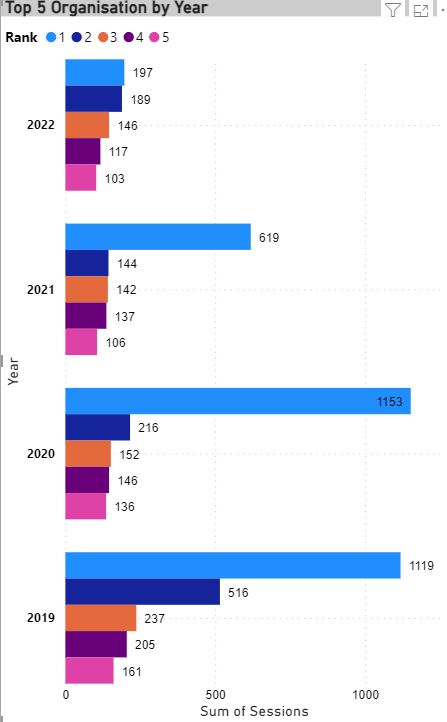
2.Study Sessions Change over Years
We are going to show the trend of sessions change over financial years from 2019 to 2022.
01. Combine Datasets
We have excel files like 'Power BI - XXX Council 20xx-20xx Landing Page.xlsx' from 2019 to 2022.
1. Upload all of them to Power BI.
2. Drop unused columns.
3. Use DAX UNION to combine these tables to one talbe which is named as 'SessionAll'. The code is as follows:
SessionAll = UNION(Session2019, Session2020, Session2021, Session2022)
02. Add Rank
The simplest way to list the top five organizations with the most session per year is showing top five for every year separately, but it need us to create 4 bar chart and is contrary to our original intention. To reach our goal, we need to add a rank column to the table and it is the rank for session by years.
CategoryRank =
CALCULATE (
COUNTROWS ( SessionAll ),
ALLEXCEPT ( SessionAll, SessionAll[Year] ),
SessionAll[Sessions] >= EARLIER ( SessionAll[Sessions])
)
The code above is like rank over session partition by year in SQL.
03. Build Clustered Bar Chart
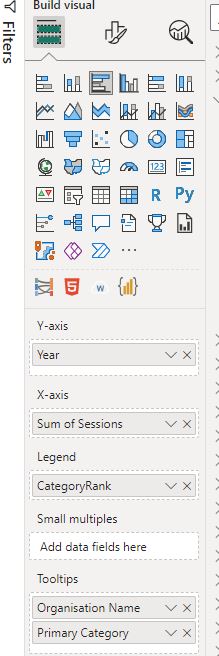
To show the name of organizations in the reports, we choose stacked column chart as an alternative.