![]()
![]()
![]()
Exploration of Power BI Tools - Kane Hengchuan Zhao
Exploring Power BI with Python and more useful visualisation tools, along with useful open data website sources to obtain data.
Intern Kane Hengchuan Zhao has been assisting the Data Analytics Team with capacity building, by exploring and documenting the various coding, tools and methods that can be used when presenting data for councils in Power BI. This allows for better visual representation and greater data insight generation when using the SAcommunity open dataset.
1. Building Pages Using Python
01. Prerequisites
You need to download Python and Power BI Desktop and then follow the instruction of Run Python scripts in Power BI Desktop.
02. Example for Tables
We can rebuild a table Character which only contians A to Z using Python script. The code is as follows:
import pandas as pdimport pandas as pddata = [chr(i) for i in range(ord('A'), ord('Z')+1)]df = pd.DataFrame(data,columns=['Character'])print (df)03. Example for Visuals
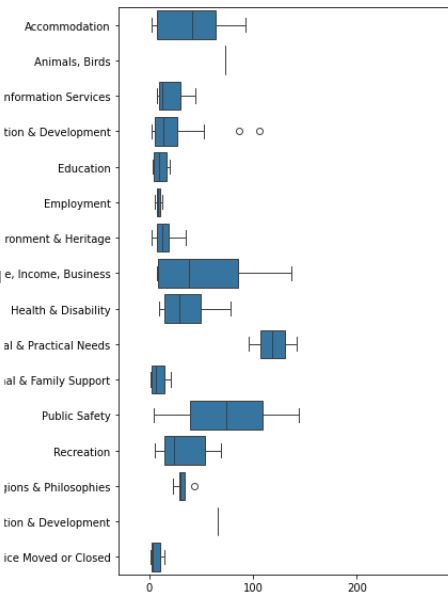
A simple boxplot sessioin by primary category.
# The following code to create a dataframe and remove duplicated rows is always executed and acts as a preamble for your script:
# dataset = pandas.DataFrame(Primary Category , Sessions) # dataset = dataset.drop_duplicates()
# Paste or type your script code here: import pandas as pd import matplotlib.pyplot as plt import seaborn as sns
sns.boxplot(y="Primary Category ", x="Sessions", data=dataset)
plt.show()The disadvantage is that there is no linkage or interaction, and it is simply displayed as a picture.
2.Useful Visualisation Tools
01. How to Add
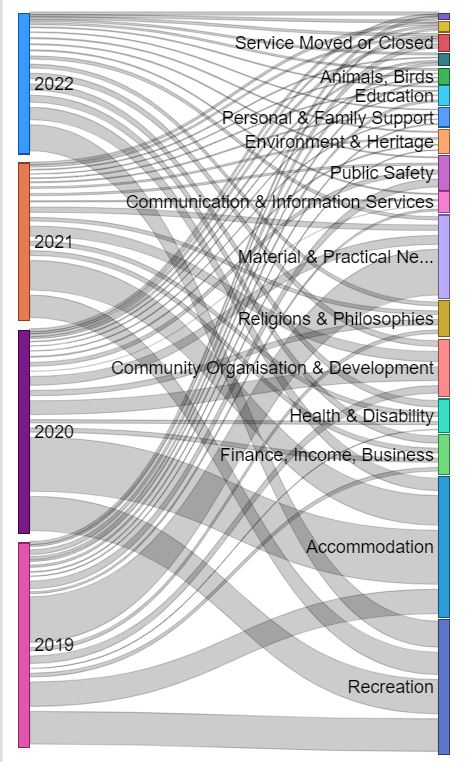
02. Sankey
Sankey diagrams emphasize the major transfers or flows within a system. They help locate the most important contributions to a flow. They often show conserved quantities within defined system boundaries. -- Wikipedia
We use sankey to show the contribution of sessions between years and primary category.
03. WordCloud
In our report, the words(all services) appear bigger the more often they are shown.

3.Useful Open Data Websites
01. Data.SA
From Data.SA we can get all kinds of different data, you can search based on your interests. But some data is outdated and needs to be carefully screened. You can also download dataset using CKAN API if you wish, but it's more simple and convenient to download it directly.
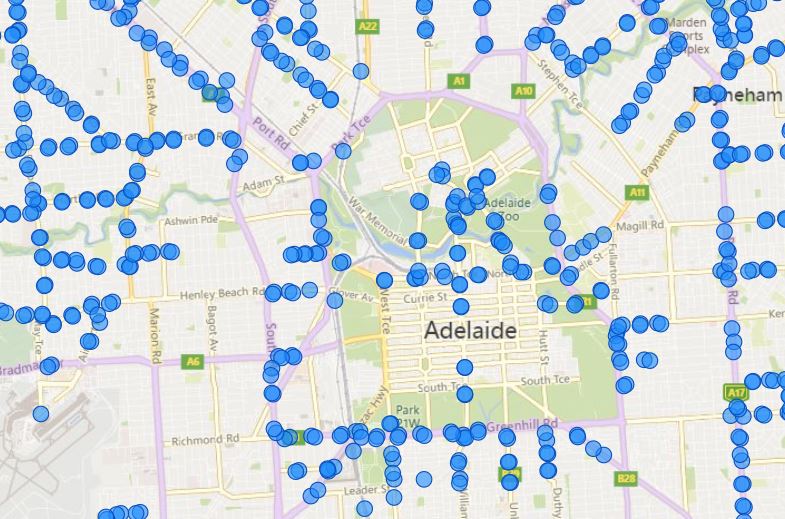
There is an example showing the bus stops within Adelaide using data from Data.SA.
02. Australian Bureau of Statistics
The Australian Bureau of Statistics contains variety of data. For example, we can access Australia-wide census data to show how the population and composition of a specific area are changing.
03. SA Health
From SA Health, we can get health statistics with different topic. If you want to do some research related to health, you can check this website to get some idea.
