![]()
![]()
![]()
Berri Barmera Council
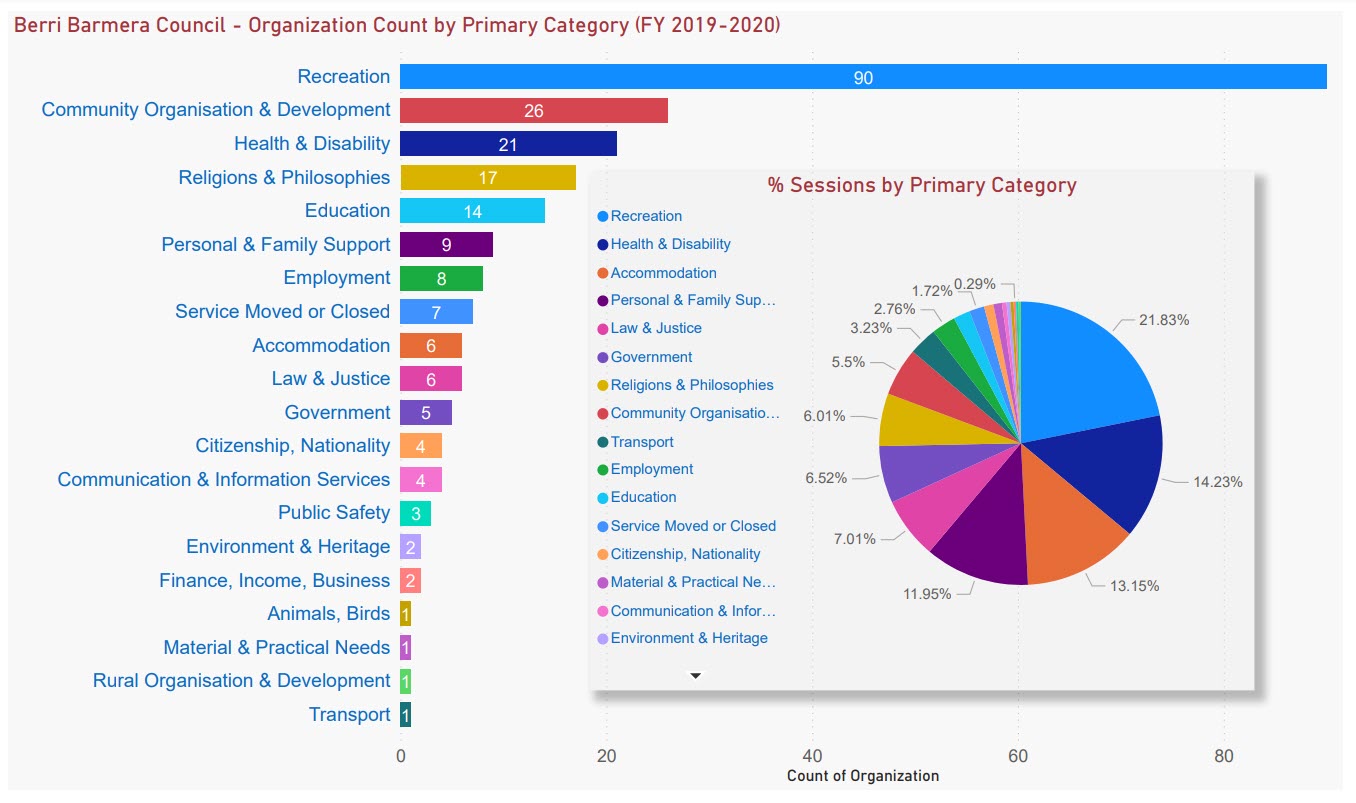
Berri Barmera Council Data Analytics FY 2019-2020
Berri Barmera Analytics Overview FY 2019-2020 - Canva - PDF
Berri Barmera Analytics Overview FY 2019-2020 - Power BI Export - PDF
Berri Barmera Analytics Overview FY 2019-2020 - Power BI Embedded Report (Interactive Public)
~Prepared by Volunteer Hang Zhang
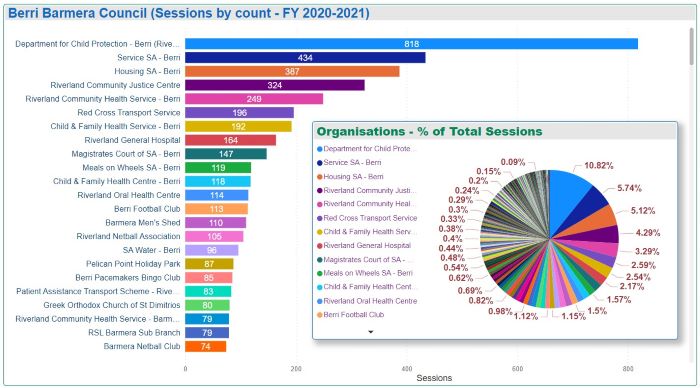
Berri Barmera Council Data Analytics FY 2020-2021
Berri Barmera Analytics Overview FY 2020-2021 - Canva - PDF
Berri Barmera Analytics Overview FY 2020-2021 - Power BI Export - PDF
Berri Barmera Analytics Overview FY 2020-2021 - Power BI Embedded Report (Interactive Public)
~Prepared by Volunteer Renu Bala
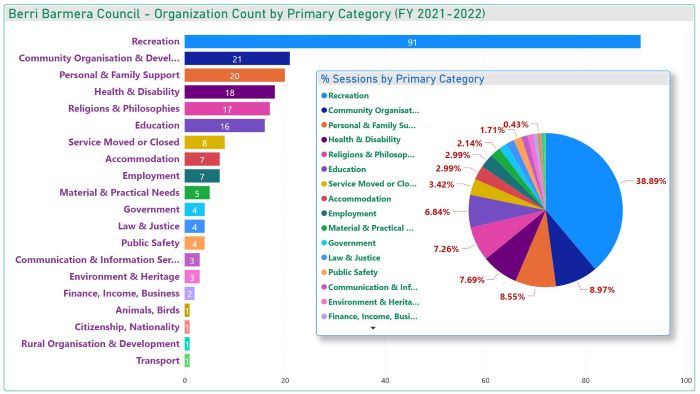
Berri Barmera Council Data Analytics FY 2021-2022
Berri Barmera Analytics Overview FY 2021-2022 - Canva - PDF
Berri Barmera Analytics Overview FY 2021-2022 - Power BI Export - PDF
Berri Barmera Analytics Overview FY 2021-2022 - Power BI Embedded Report (Interactive Public)
~Prepared by Volunteer Stathis Avramis
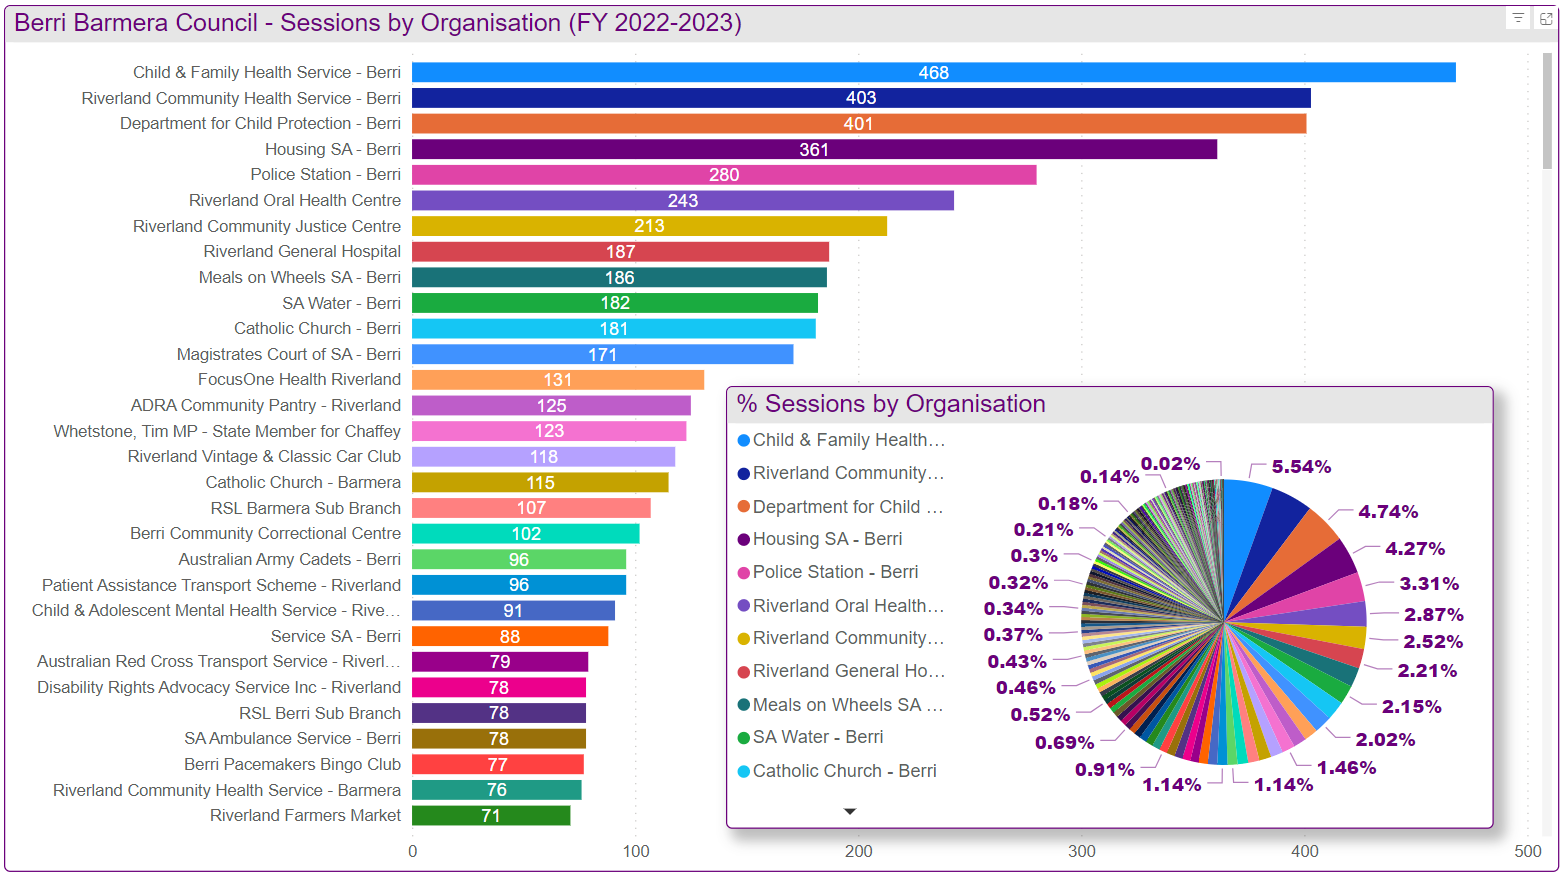
Berri Barmera Council Data Analytics FY 2022-2023
Berri Barmera Analytics Overview FY 2022-2023 - Canva - PDF
Berri Barmera Analytics Overview FY 2022-2023 - Power BI Export - PDF
Berri Barmera Analytics Overview FY 2022-2023 - Power BI Embedded Report (Interactive Public)
~Prepared by Intern Yi Han
Berri Barmera Analytics 4 Year Comparison Report - Power BI
Berri Barmera Analytics 4 Year Comparison Report - PDF
~Prepared by Intern Yi Han
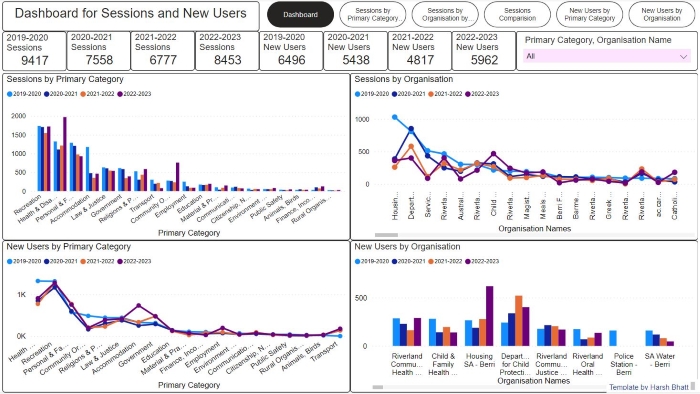
Data Insights
To analyze and discuss the significant changes in sessions and the number of new users as outlined in the Power BI report across the years for different categories, it's essential to understand the underlying factors contributing to these variations. The fluctuations in these metrics across Health & Disability, Accommodation, and Community Organization & Development categories over the years are influenced by several external factors, notably including the COVID-19 pandemic and regional events such as floods.
Health & Disability (2022-2023)
The remarkable increase in sessions for organizations such as Child & Adolescent Mental Health Service - Riverland, Child & Family Health Service - Berri, FocusOne Health Riverland, and Medicare Australia - Berri reflects a growing demand for health and mental health services in the aftermath of the pandemic. This could be attributed to heightened awareness and the accumulated needs for mental health support, especially among children and adolescents. The numbers almost doubling, tripling, or more indicate a significant societal shift towards prioritizing mental health and accessibility to related services.
Accommodation (2019-2020 & Recovery Post-COVID19)
Housing SA - Berri's sessions peaking in 2019-2020 (1031 sessions) followed by a steep decline during the peak years of COVID-19, (dropped to only 387 and then 260) align with global travel restrictions and the general public's hesitancy to travel. The slight recovery in 2022-2023 (increased to 361) suggests a gradual return to pre-pandemic norms, albeit still impacted by lingering caution and perhaps changes in travel behaviors.
Community Organization & Development (2022-2023)
The surges in sessions related to the Riverland Farmers Market and police stations in Berri and Barmera likely due to flood events underscore the importance of community organizations in times of crisis. Such organizations become focal points for information, support, and resources, driving increased online engagement.
New Users Trends
The increase in new users mirrors the trends in session increases, suggesting that the events and conditions leading to more sessions are also attracting new individuals to these services and organizations. This parallel growth indicates broader engagement with the organizations' offerings and possibly a larger shift in the community's needs and interests.
Specific Observations
SA Water's consistent growth in new users could reflect ongoing efforts to engage with the community or a growing population in the service area.The significant rise in popularity for the Riverland Vintage & Classic Car Club might be tied to a surge in wealth in post-pandemic, indicating changing demographics or interests in the region. Overall, these patterns highlight the critical impact of external events such as pandemics and natural disasters on community engagement with various service categories. They also underscore the evolving nature of community needs and interests, particularly in response to significant societal challenges.
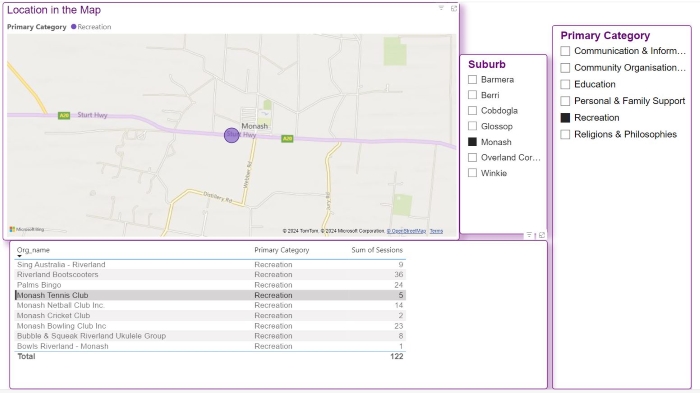
Berri Barmera map visualisation in Power BI - Power BI Embedded Report
Select the organisation to find out its location within the council map.
~Prepared by Intern Yi Han
