![]()
![]()
![]()
LGA Statistics Project - Mapping services in SA
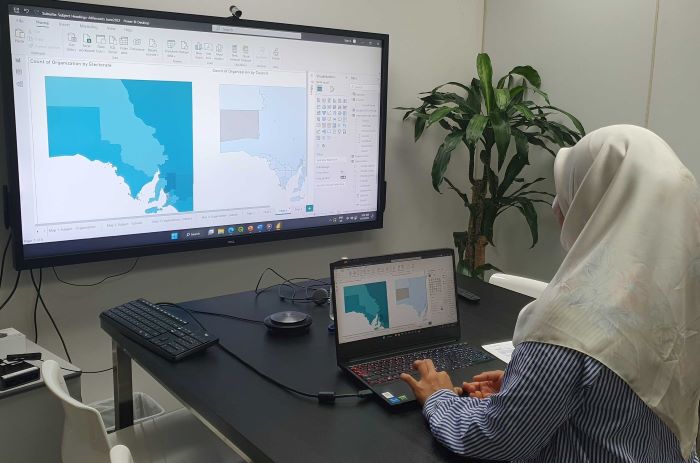
Image: The LGA Statistics Project for SAcommunity is being undertaken by University Intern Putri Kamaluudin in the Agile room, Connecting Up office, Infoxchange.
The LGA Statistics Project aims to map community service organisations based on their location within local councils, extending to state electorate, and (soon) federal electorate boundaries in South Australia.
While the existing data in the SAcommunity directory is valuable, we can better visualize and gain insights into service data stories by presenting the location of organizations via maps.
Mapping All Community Services in South Australia
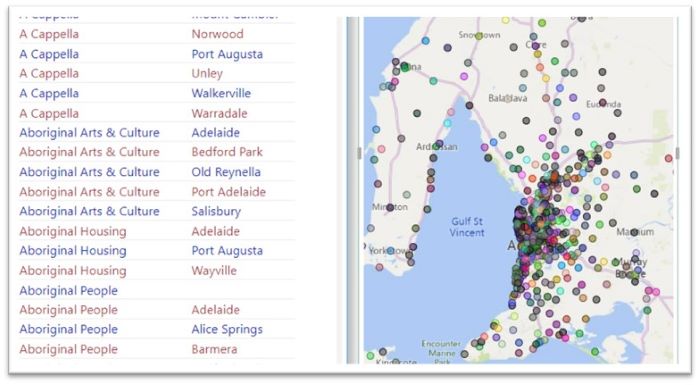
Image: All SAcommunity listed services plotted across a map of South Australia
We can plot services as data points scattered throughout South Australia, however many of these organisations overlap, particularly in the metropolitan region. To disperse the distribution of points and make better sense of this data, we can categorise our information based on Local Government Areas (LGA) i.e. council boundaries and expand this to include state electorate boundaries.
"Local Government Area (LGA) is a spatial unit which represents the whole geographical area of responsibility of an incorporated Local Government body/council (Australian Standard Geographical Classification (ASGC))."
Why do LGA boundaries matter?
Mapping out SAcommunity service organisations based on council boundaries or state electorates is crucial for both government bodies and the listed organisations. Allowing each group to identify and understand their specific local community in association with the community service connections and government networks available.
Local government bodies perform a wide range of community shaping functions for the constituents they represent and the residents they administer to in their specific area, in association with community services operating in that region. Visualising and presenting this data more effectively and plotting community organisations within boundaries of governance, assists with community/government engagement processes. Improving consultation, identifying assistive services; providing or locating potential funding or grants, and connecting residents to local resources.
The ability to map organisations and visualise this data more effectively to differentate between council boundaries and state electorate boundaries is necessary. Councils and Electorate maps cover different regions, therefore different community services are located under different governance structures. Mapping can assist each group in understanding 'Who does what? Where?'.
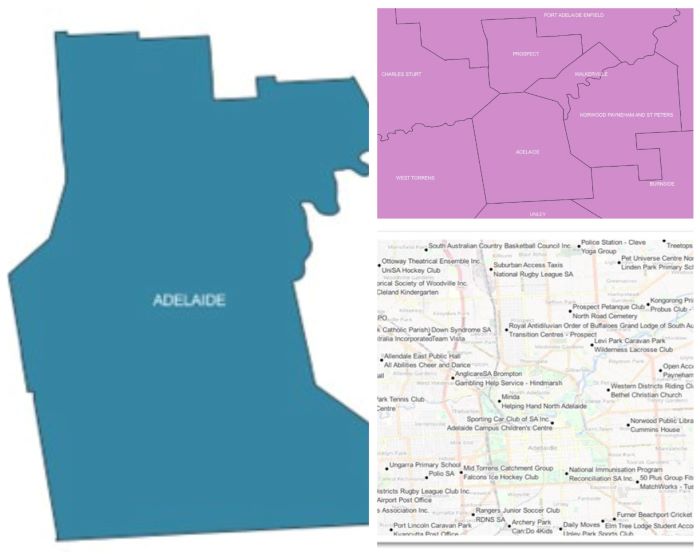
Image: A) Adelaide State Electorate boundary map, B) Adelaide Council boundary map, C) Community services plotted across the Adelaide metropolitan region
Creating Maps of Meaning
The maps in the images above use Adelaide City to illustrate state, council boundaries and community services scattered throughout the metropolitan region. These maps are difficult to read and derive meaning, and therefore demonstrate the need to combine boundaries with community service data points to create a better visualisation.
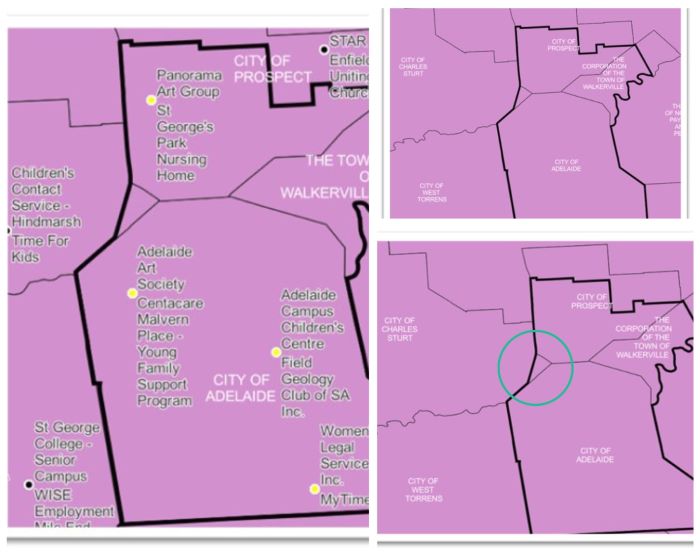
Image: A) Community services data plotted within Adelaide State Electorate B) Adelaide State Electorate crossing various council boundaries C) Highlighting City of Charles Sturt % in Adelaide State Electorate
By combining the state electorate map for the Adelaide electorate against the Adelaide council map, we can display the state boundaries and overlapping councils. By then plotting community services within these boundaries we can then visualize the distribution of these organizations in a better way.
For example, The entire City of Adelaide Council, 75% of the City of Prospect and The Town of Walkerville and ~10% of the City of Charles Sturt all fall within the Adelaide State Electorate.
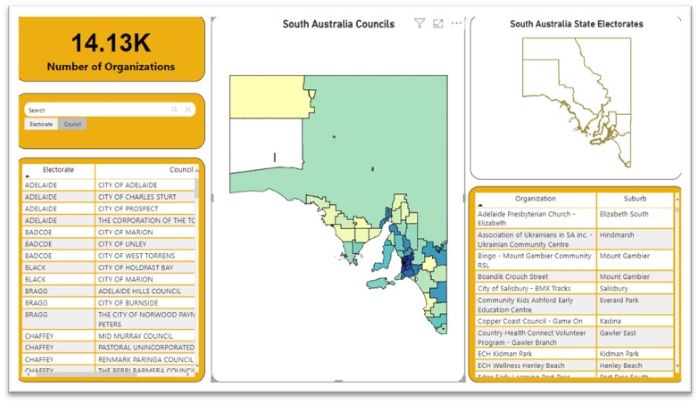

Image: A) Using Power BI to visualise and explore data across South Australian State Electorates and Local Councils. B) Selecting electorates/councils C) Generating Electorate/Council Data D) Maps to visualise boundaries E) Community Service Organisation data
Microsoft Power BI
Microsoft Power BI is an interactive data visualization software which allows the exploration of this data further. This tool is currently used to create meaningful dashboards and reports for users and tell 'data stories' for each region, and is currently a work in progress.
Local government bodies perform a wide range of community shaping functions for the constituents they represent and the residents they administer to in their specific area, in association with community services operating in that region. Visualising and presenting this data more effectively and plotting community organisations within boundaries of governance, assists with community/government engagement processes. Improving consultation, identifying assistive services; providing or locating potential funding or grants, and connecting residents to local resources.
The ability to map organisations and visualise this data more effectively to differentate between council boundaries and state electorate boundaries is necessary. Councils and Electorate maps cover different regions, therefore different community services are located under different governance structures. Mapping can assist each group in understanding 'Who does what? Where?'.
Image: A) Adelaide State Electorate boundary map, B) Adelaide Council boundary map, C) Community services plotted across the Adelaide metropolitan region
Creating Maps of Meaning
The maps in the images above use Adelaide City to illustrate state, council boundaries and community services scattered throughout the metropolitan region. These maps are difficult to read and derive meaning, and therefore demonstrate the need to combine boundaries with community service data points to create a better visualisation.
Image: A) Community services data plotted within Adelaide State Electorate B) Adelaide State Electorate crossing various council boundaries C) Highlighting City of Charles Sturt % in Adelaide State Electorate
By combining the state electorate map for the Adelaide electorate against the Adelaide council map, we can display the state boundaries and overlapping councils. By then plotting community services within these boundaries we can then visualize the distribution of these organizations in a better way.
For example, The entire City of Adelaide Council, 75% of the City of Prospect and The Town of Walkerville and ~10% of the City of Charles Sturt all fall within the Adelaide State Electorate.
Image: A) Using Power BI to visualise and explore data across South Australian State Electorates and Local Councils. B) Selecting electorates/councils C) Generating Electorate/Council Data D) Maps to visualise boundaries E) Community Service Organisation data
Microsoft Power BI
Microsoft Power BI is an interactive data visualization software which allows the exploration of this data further. This tool is currently used to create meaningful dashboards and reports for users and tell 'data stories' for each region, and is currently a work in progress.
