![]()
![]()
![]()
Adelaide University Internship - Joy Meixuan Liao

Welcome Meixuan!
Meixuan Liao (Joy) has joined our Data Analytics Team for her Adelaide University SET (Sciences, Engineering and Technology) Internship as part of her Master of Data Science, Trimester 2, 2025, from 27 May 2025 to 22 August 2025.
She is completing a 140-hour onsite internship with SAcommunity at the Connecting Up Office, Infoxchange, working 2 days per week over 12 weeks.
Total Hours: 140 Joined: 27 May 2025 Last Check-in: 6 August 2025 (completed/retired)
Personal Biography
Meixuan is currently in her final trimester of the Master of Data Science program at the University of Adelaide, with a diverse background in agricultural science, consulting, and communication. After completing her undergraduate and Honours degree in Agricultural Science, she began her career as a casual Research Computing Staff, focusing on experimental design and statistical analysis. She later worked as an Agricultural Consultant. Currently, she works as a Student Ambassador at the University
At Connecting Up, Meixuan is interning in the Data Analytics team, contributing to projects that support the not-for-profit sector. Besides accumulating experience in data analytics roles within the real-world industry, she aims through this program to gain a deeper understanding of the community where she lives, and to build connections to the council and not-for-profit sector in the area she plans to stay in for the future.
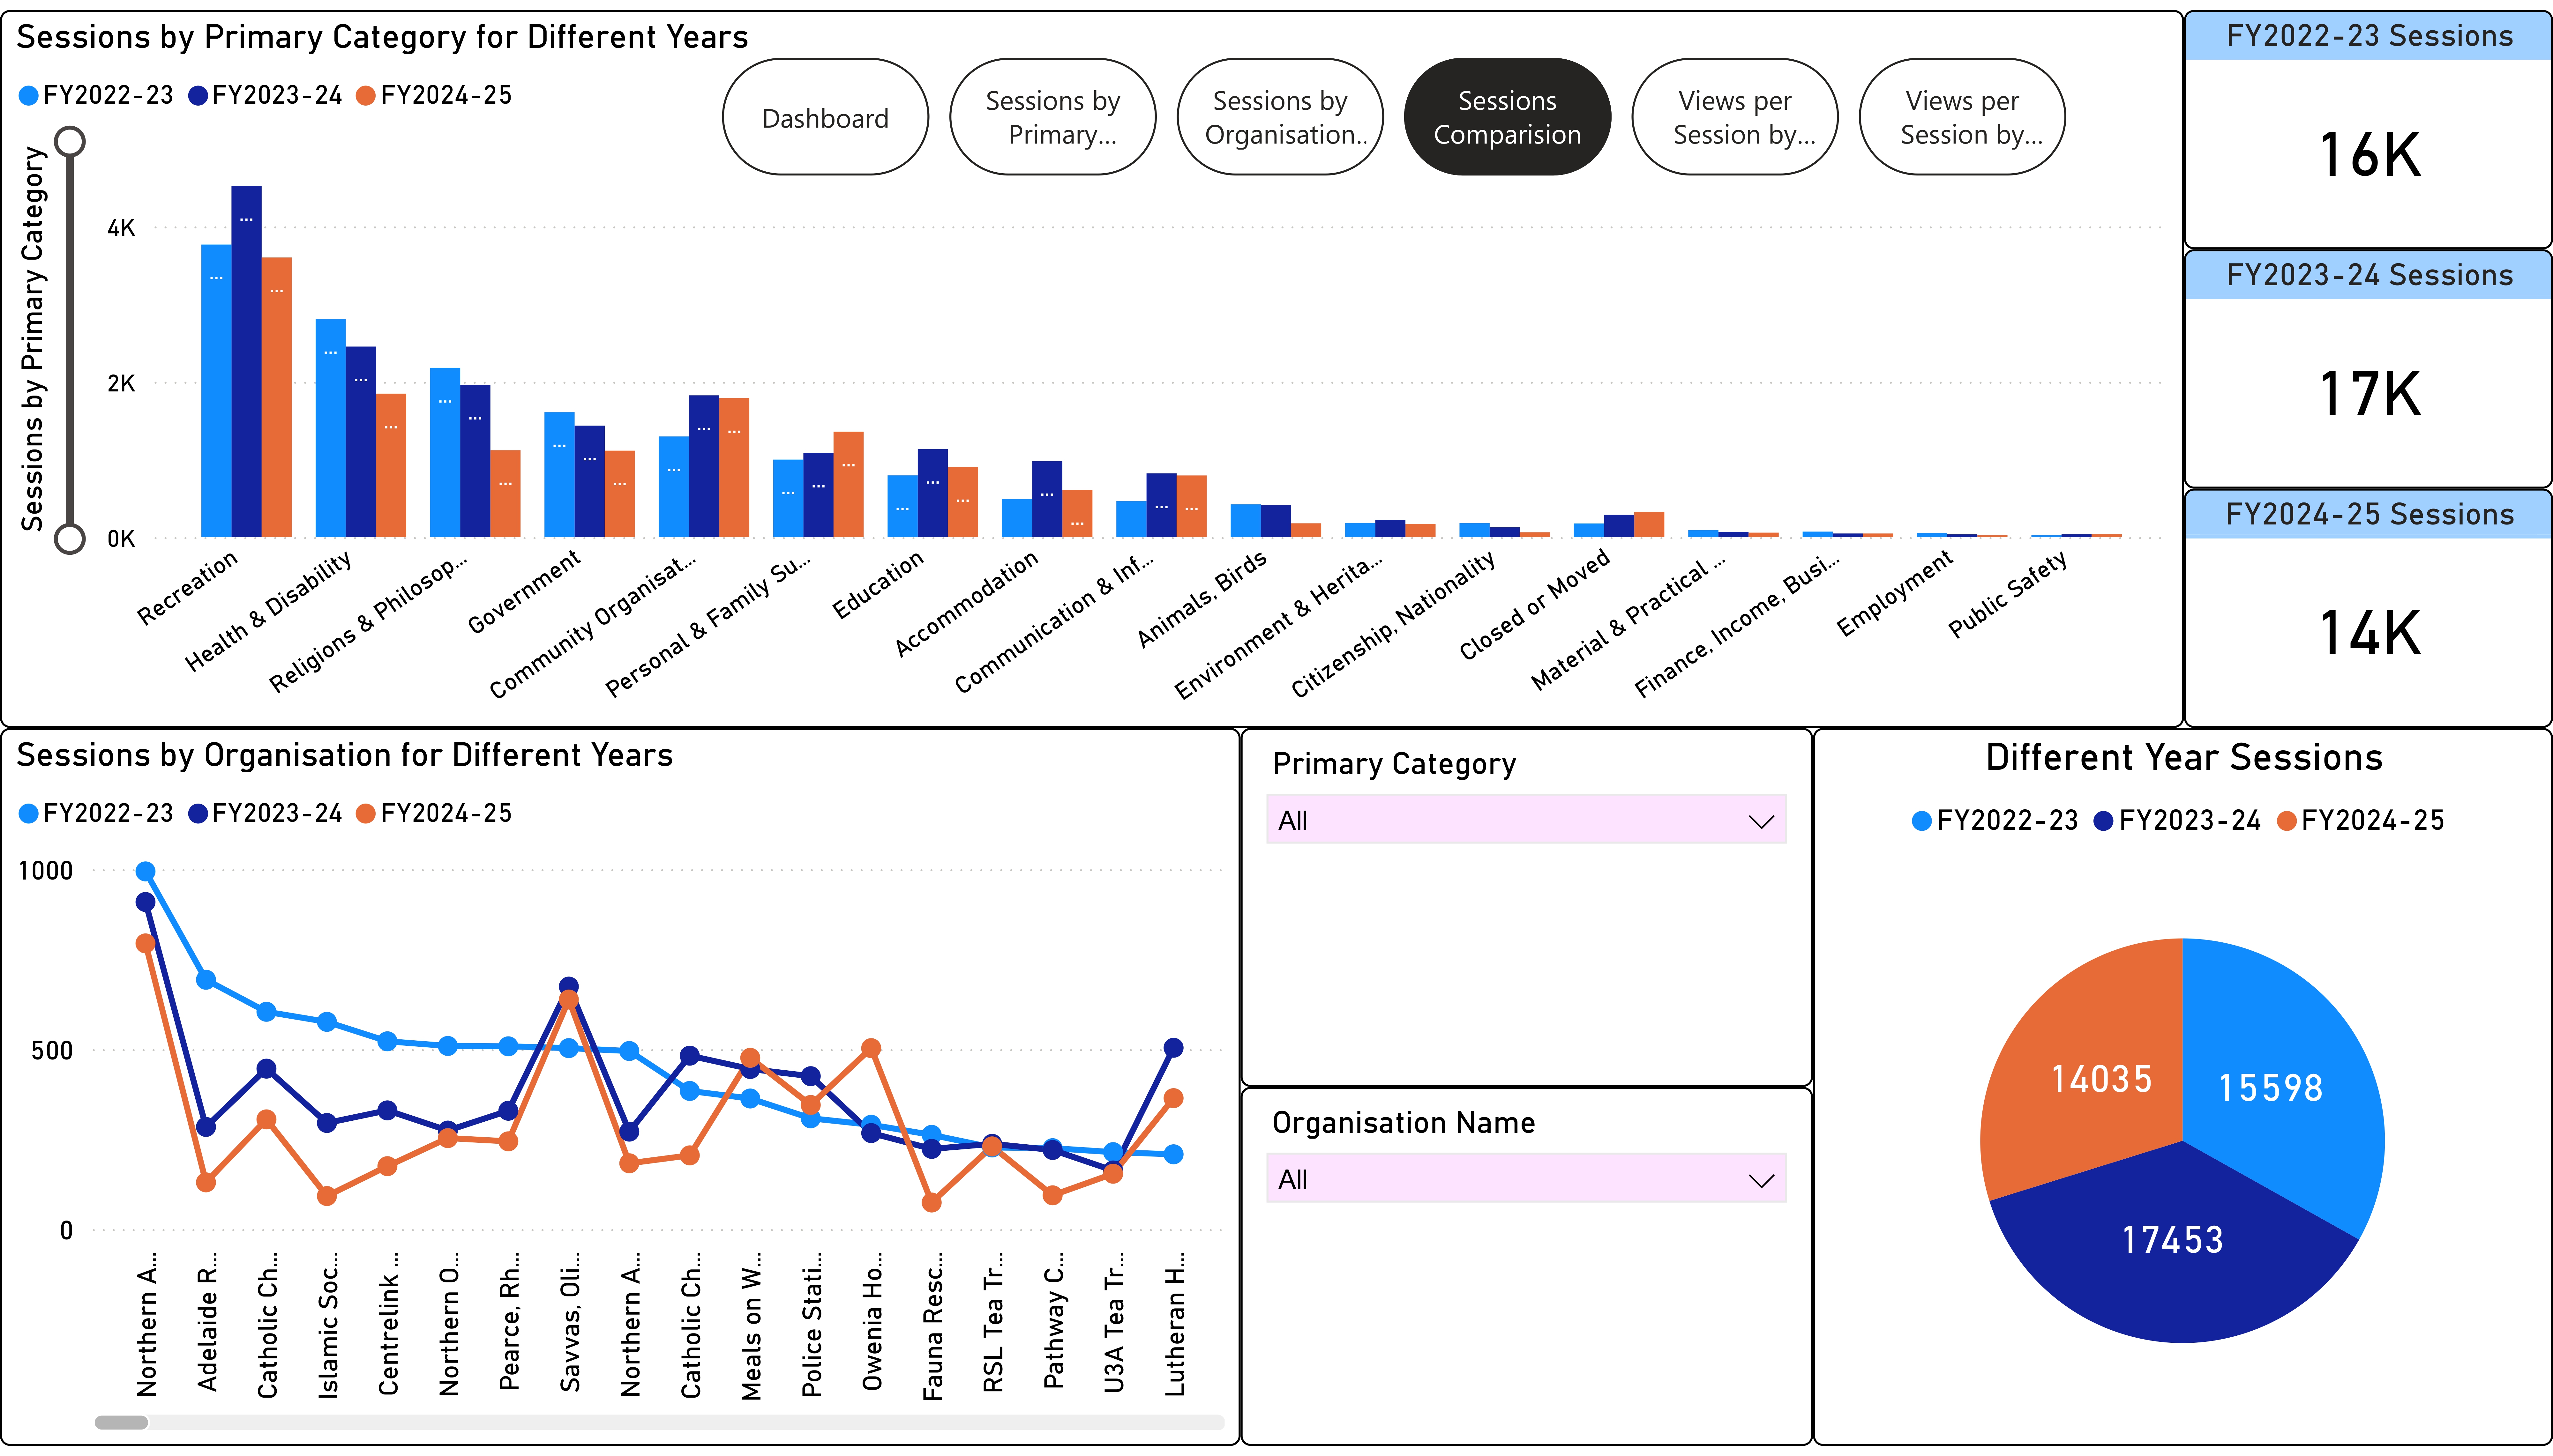 Tea Tree Gully Council Three Years Comparison Report
SAcommunity Project in Community Service Statistics for Local Councils
The SAcommunity Community Service Statistics project provides local councils across South Australia with summarised data on community services. Using Power BI, we visualise web analytics through dynamic, interactive reports tailored for each financial year (FY). These comprehensive reports offer insights into community needs by highlighting service counts, session percentages, and detailed service-specific visits, enabling councils to effectively respond to local service demands.
I focused on data from the City of Tea Tree Gully a dataset of 369 records, updating and cleaning 94 records for the financial years 2023–24 and 2024–25, along with a three-year comparison covering the previous financial years. Once the Power BI reports were finalized, I designed infographics in Canva to highlight key metrics—ensuring the insights were clear, engaging, and accessible to non-technical audiences. After completing the Power BI report, I reached out to the relevant council to share the findings on 5 August 2025 to provide them with useful statistics to support their decision-making. The reports I created for the council can be found >>here.
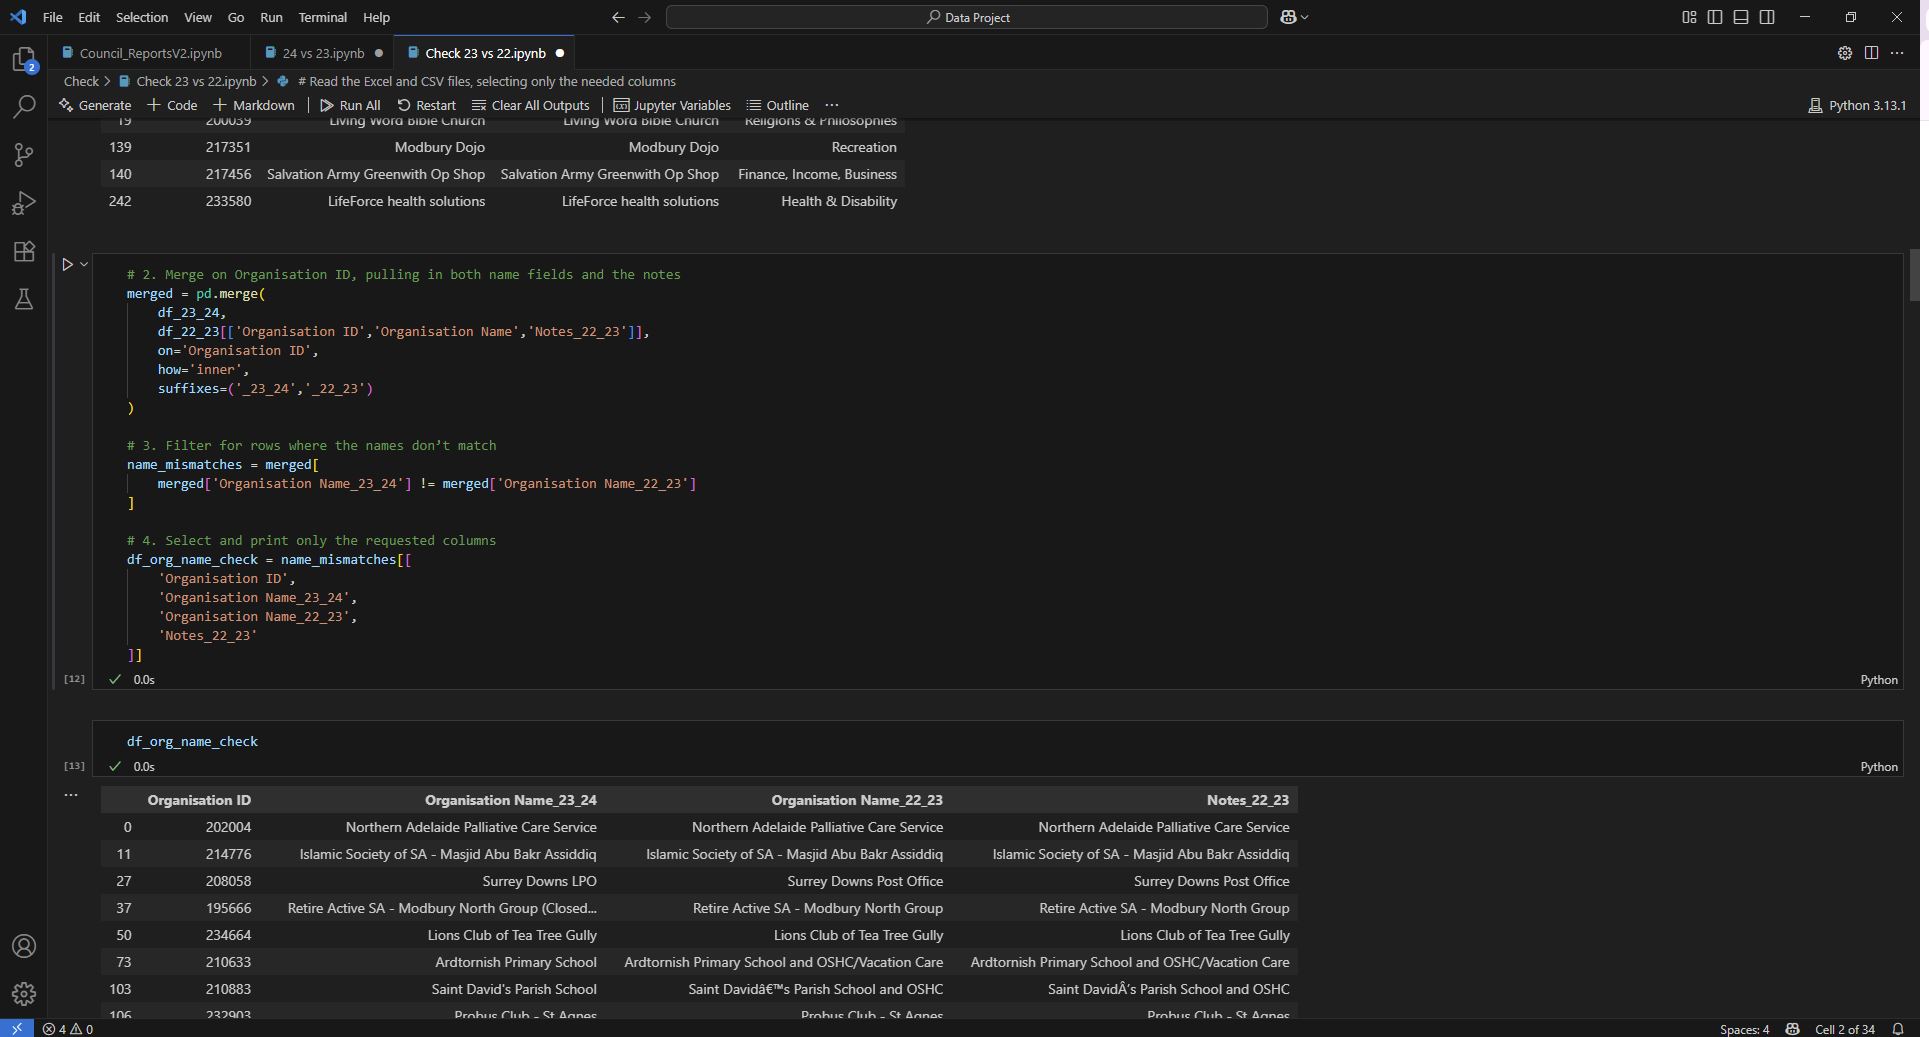 Year-to-Year Comparison: Python Code
This project followed a structured, step-by-step workflow to ensure data accuracy and meaningful insights:
1. Data Extraction: Collected community service records from the SAcommunity website, organized by financial year. Additionally, exported GA4 analytics data to capture user interactions and service search behavior.
2. Data Cleaning: Used Python scripts developed by Anubhav to correct typos, standardize fields, and format the dataset for Power BI integration.
3. Initial Automated Quality Assurance: Developed simple Python scripts to compare current and previous years’ data for the same council. These scripts flagged discrepancies, performed keyword-based checks across service sections, and helped identify unusual entries—guiding a more focused manual review.
4. Manual Verification: Cross-checked cleaned data against the live SAcommunity site to confirm active services and validate primary categories. This included direct outreach to service coordinators for verification.
5. Visualization: Created interactive dashboards in Power BI and designed infographic layouts in Canva, using adapted templates from previous projects to ensure clarity and accessibility for non-technical audiences.
6. Next Steps:
- Consolidated three years of data into individual sheets following Harsh’s data preparation guide.
- Produced a cleaned dataset highlighting primary categories and organization names.
- Extracted longitude and relevant service information using Python.
- Developed an enhanced Power BI report that includes GIS mapping and multi-year comparisons.
Information and Customer Service - Data Collection
SAcommunity data is used by stakeholders including government, councils, public libraries, universities, service providers and the public for referrals, communication and research. Content is provided to Data.SA South Australian Government Data directory, and is available for GovHack, an open data competition for creative and innovative services.
Data Collection and confirming accurate data is hand-in-hand with Data Analytics need for 'good data in, good data out' relies on Customer service skills and Digital Literacy skills both critical for work readiness and ensuring accurate data.
Customer Service - Supporting and assisting not-for-profit organisations to update their contact information on the SAcommunity online directory via phone and email and online, as well as helping stakeholders to understand and access SAcommunity services available, requires great customer service skills and experience.
Before beginning customer service tasks, I received an induction from the volunteer coordinator, which covered the processes and guidelines for completing information service responsibilities. During my internship, I regularly monitored customer service inquiries and updated the SAcommunity website accordingly. Each task followed a structured process: first, reviewing the inquiry; then conducting a fact-check to ensure the reliability of the information source; followed by updating the relevant service listing; and finally, sending a confirmation email to the directory contact.
Throughout the internship, I handled a variety of updates, including changes to contact details, accessibility information, service descriptions, and organizational roles. Some tasks required verifying information through external sources such as official websites or social media pages. In cases where online forms failed or discrepancies were found, I followed up with emails to ensure accuracy and completion. These experiences strengthened my attention to detail, communication skills, and ability to manage data updates in a systematic and professional manner.
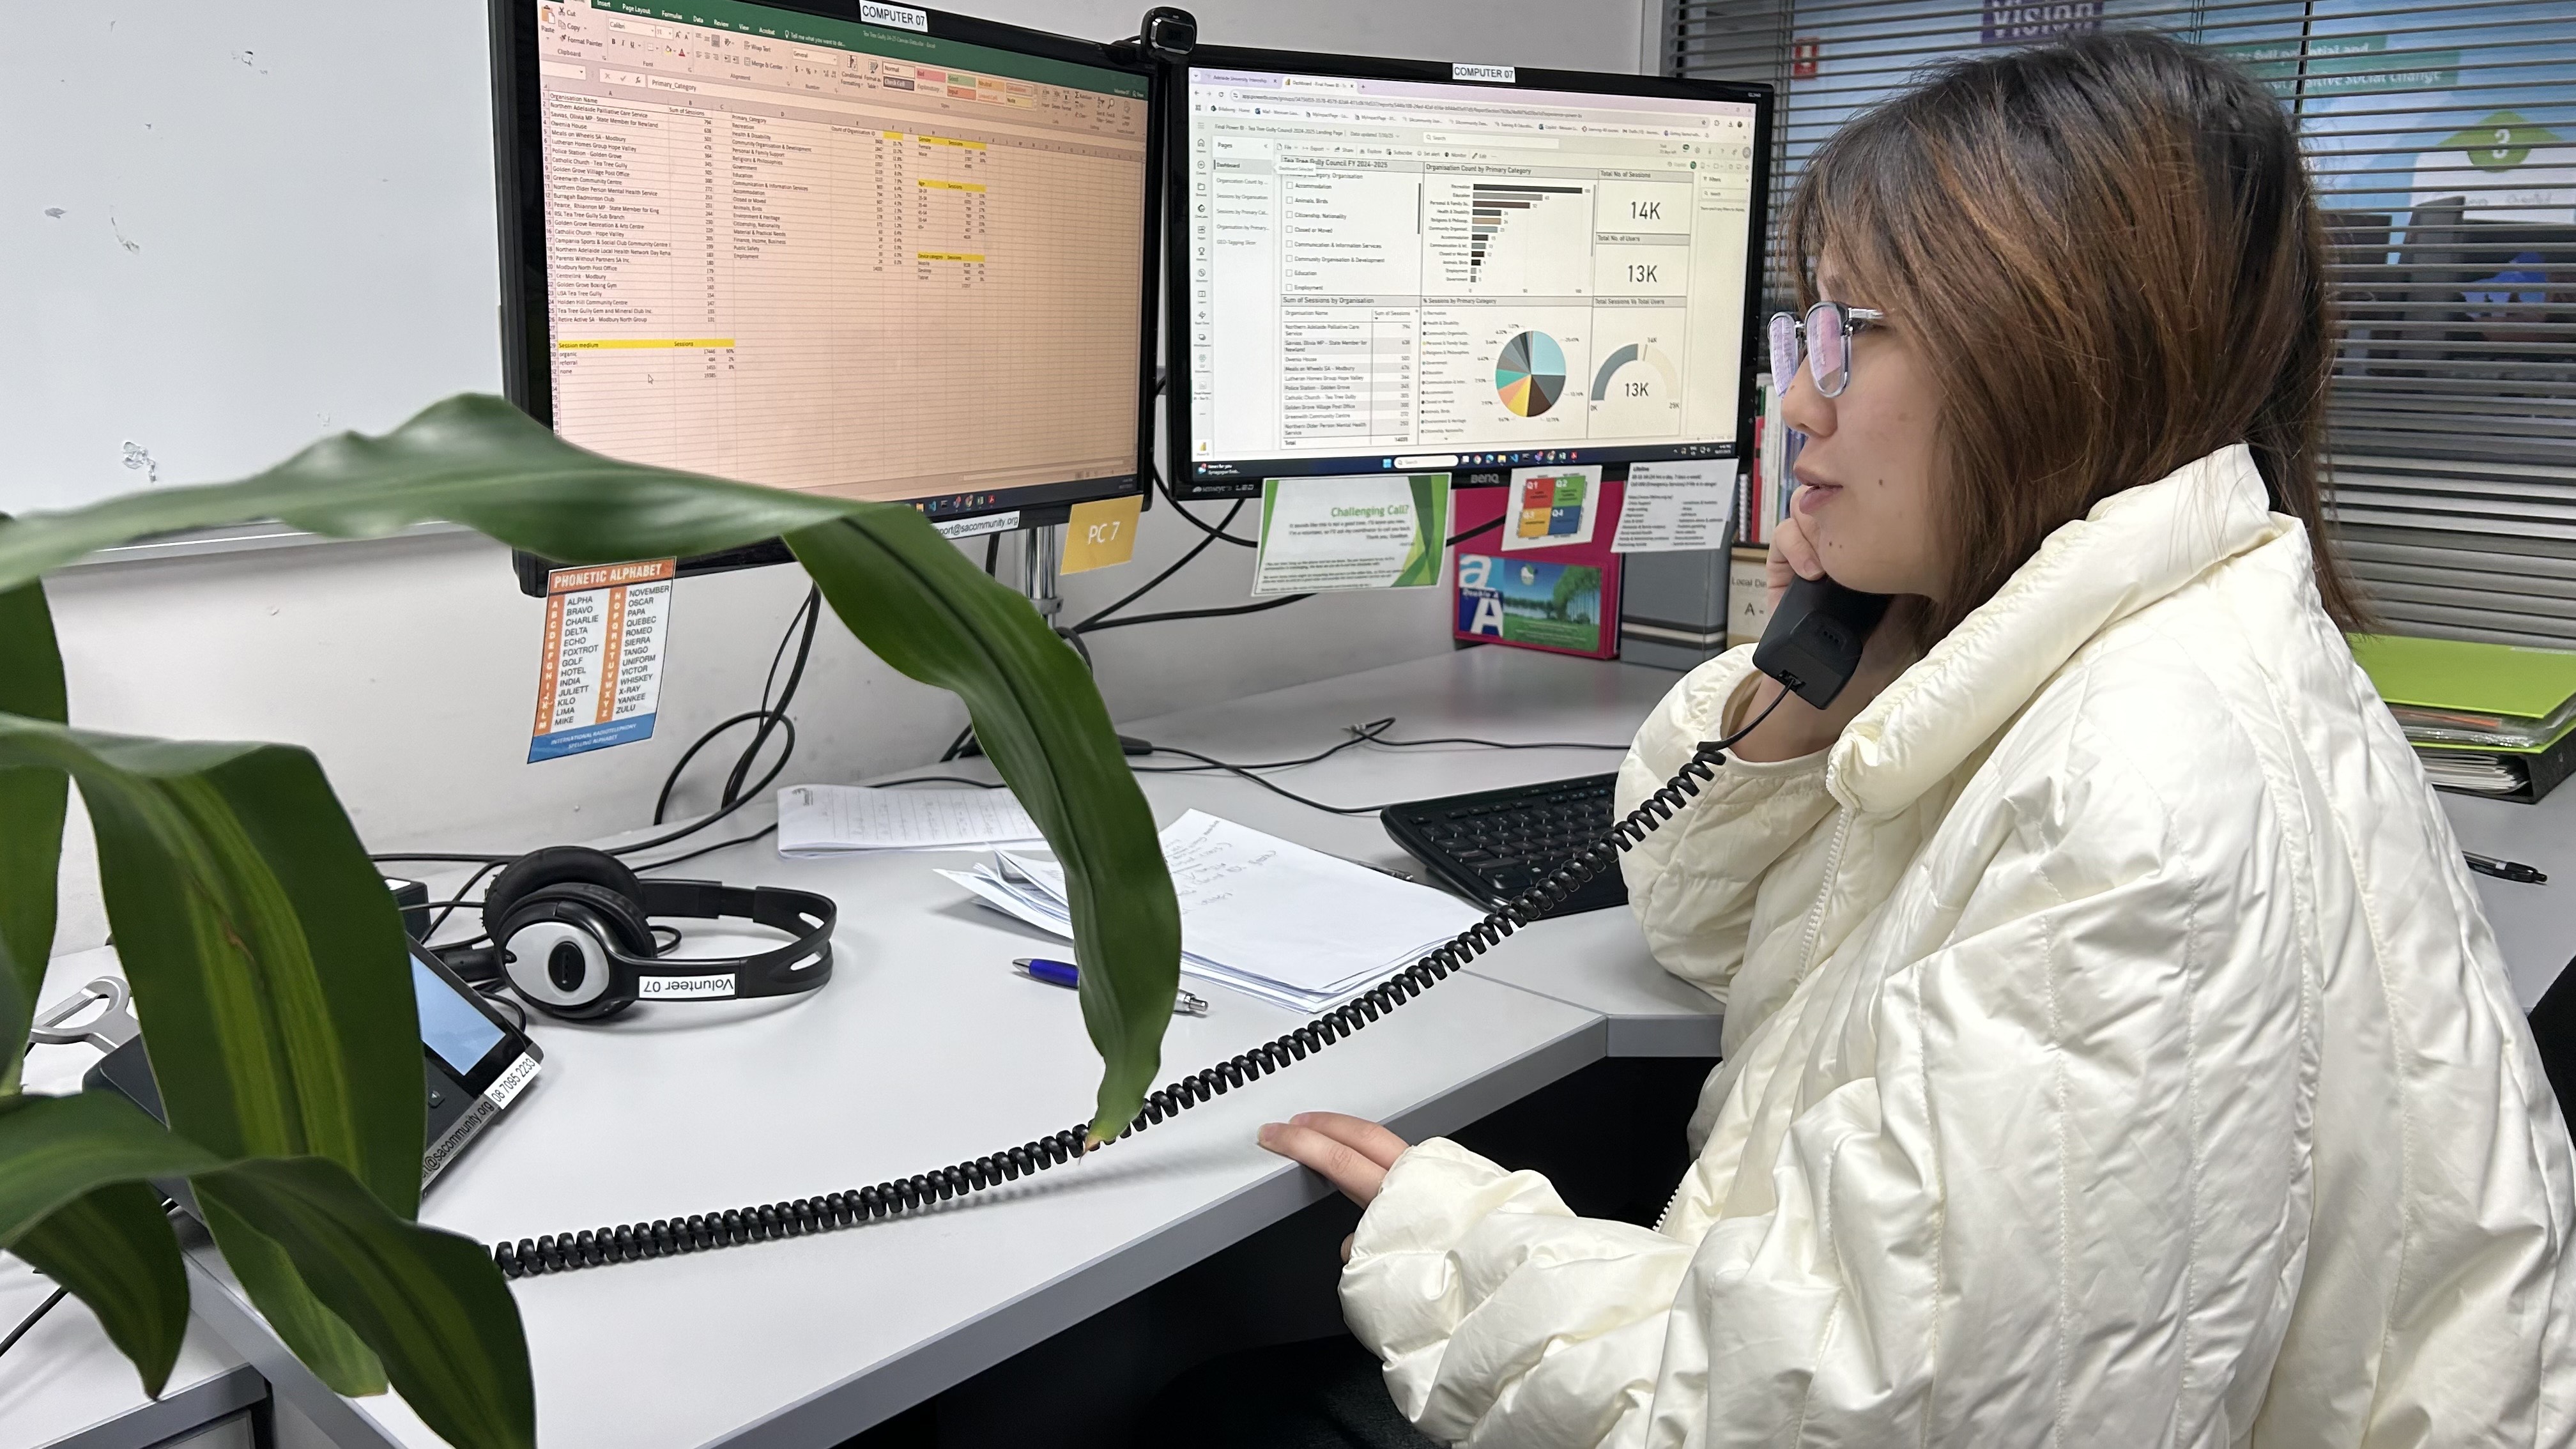 Contacting Tea Tree Gully Council Regarding Power BI Reports
Telephone Techniques
As part of our training, Connecting Up and Infoxchange provided guidance on effective telephone techniques for customer service, particularly when contacting various stakeholders. We practiced these techniques with fellow volunteers, simulating calls to directory-listed services and relevant councils to build confidence and consistency. After gaining practical experience, I contacted 10 services listed in the Tea Tree Gully Council directory to verify their current status and update their information. I also reached out to the council office directly to ensure they received our insights and understood the value of the updated data—supporting their community engagement and service planning efforts.
Capacity Building
SAcommunity plays a vital role in connecting the not-for-profit sector with the tools and capabilities needed to fulfill their mission and drive positive social change. Team members apply their administrative and information management skills through tasks such as researching community services—including government agencies, charities, and other not-for-profit organisations—online. They also contact organisations via phone and email to gather up-to-date information, and use standard style guides to update and organise listings on our public web-based directory and database, helping people connect with the services they need. During my internship, I participated in several Capacity Building programs aimed at deepening our understanding of these processes. These sessions equipped us with practical skills to manage service updates, interpret data effectively, and maintain the SAcommunity platform as a trusted resource for both service providers and the wider community.
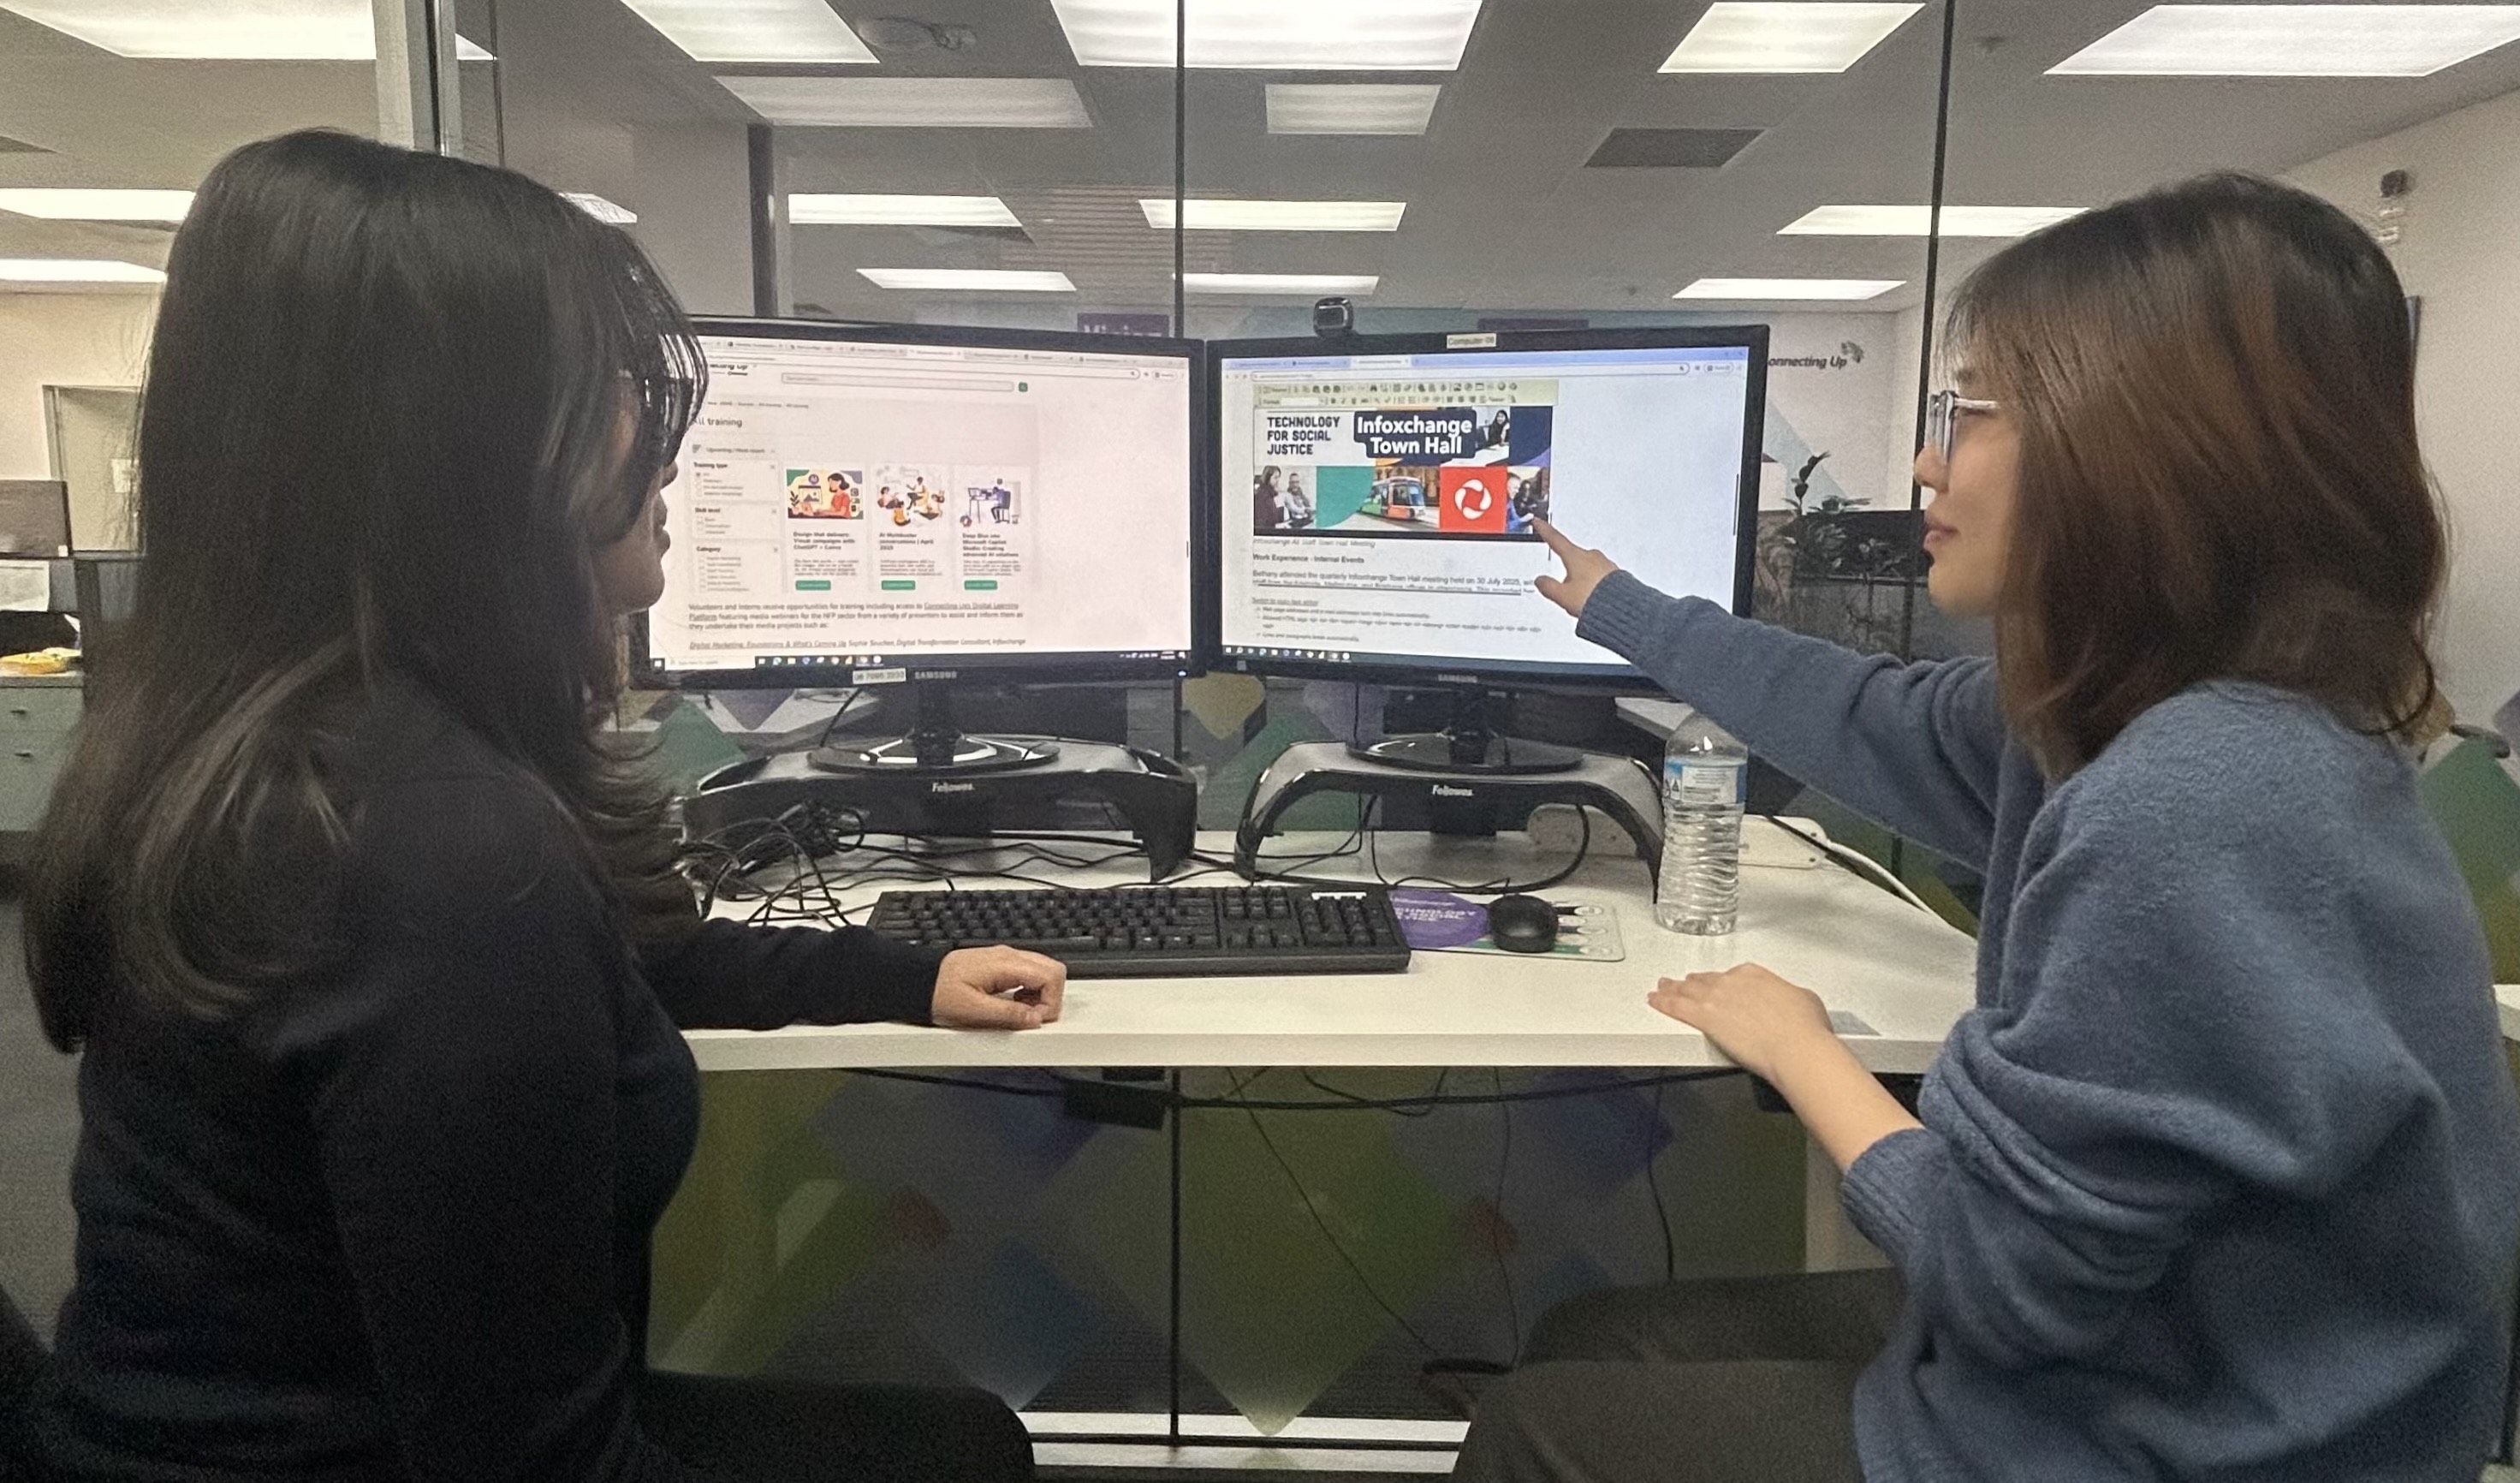 Introduction to the SAcommunity Website, Portfolio and Training platform for Bethany.
Intern/Volunteer Induction: Introduction to SAcommunity and Team Processes
As part of the capacity building process, I delivered the induction session for new interns on their first day from a peer-to-peer perspective. This included an introduction to the administrative system 'Better impact' which has an overview of the tools available and essential tasks to be completed during their first week. I also provided a brief walkthrough of their digital workspace, including how to access tools like Microsoft Teams, Slack, and Office 365. Interns were helped in following the instructions available for setting up their accounts, and informed who to contact for technical support if any issues arise.
In addition, I introduced the 'Bettter impact' eLearning, which outlines key tasks and priorities for the first week. This helped interns understand the workflow, set expectations, and begin contributing effectively from day one.
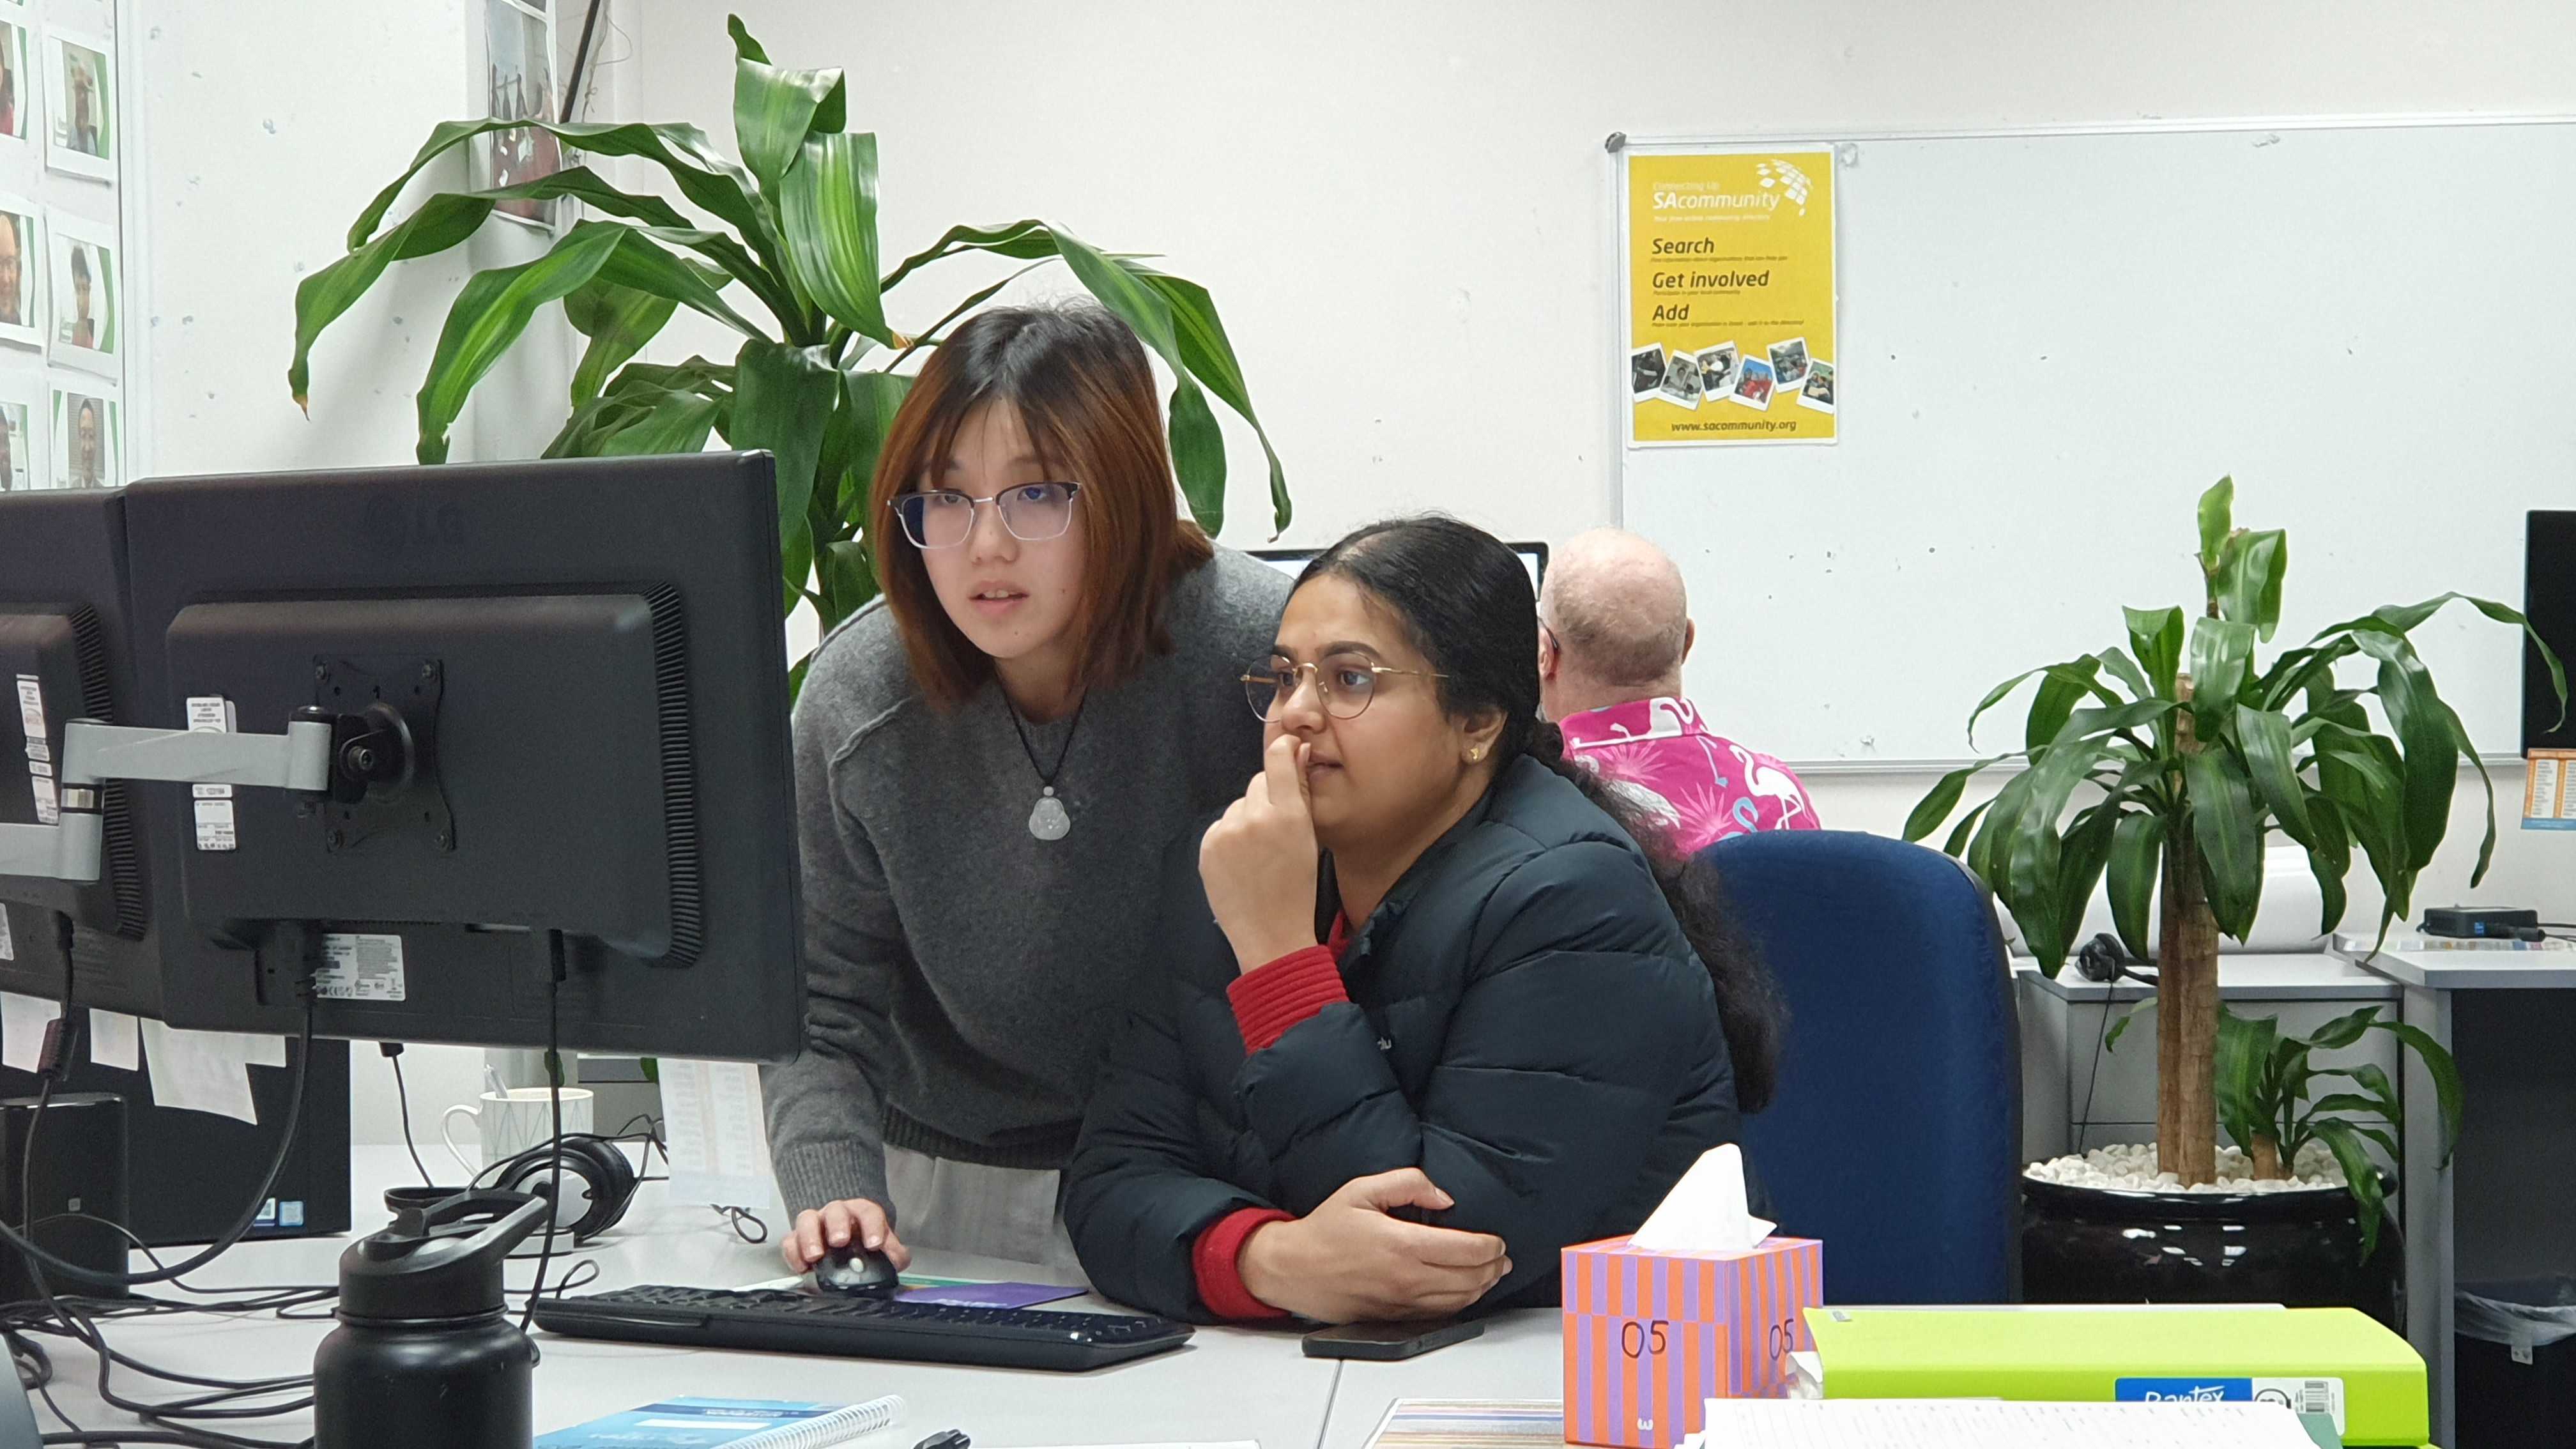 Discussion on Power BI Settings with Intern Deekshitha Podeti
Understanding and Cleaning Council Data: A Practical Introduction
As part of the capacity-building efforts, I demonstrated my data cleaning workflow to fellow interns to help them understand how to work with council data effectively. I presented key techniques such as identifying specific keywords, checking for year-to-year consistency, and interpreting the definitions and classifications of organisations. This session provided practical insights into how to approach data validation and prepare datasets for accurate reporting and analysis in Power BI.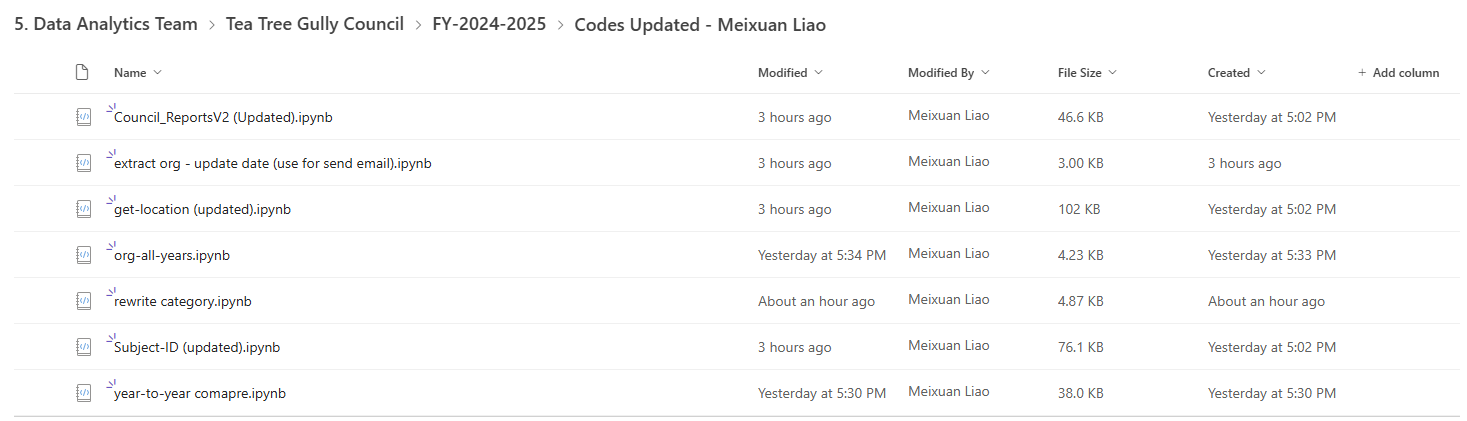
Improving and Extending Data Check Code
As part of the technical development process, interns are encouraged to manually review and improve existing Python scripts used for data validation. This involves fixing bugs, refining logic, and developing new functions to identify data quality issues and uncover meaningful insights. These enhancements help streamline the data cleaning process and ensure the accuracy of information published on the SAcommunity platform. My workflow is structured across three coordinated topics:
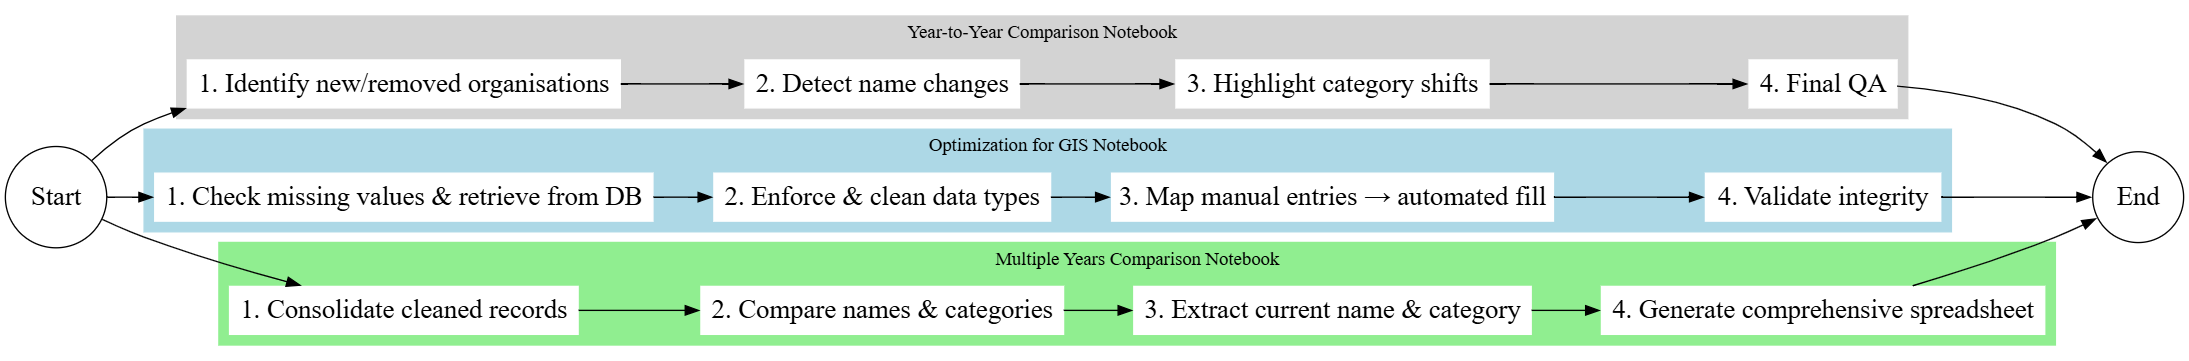 Flowchart to illustrate the optimization code workflow across three main topics
- Year-to-Year Comparison: This notebook analyzes selected financial years to identify newly added or removed organisations, detect name changes, and highlight shifts in primary service categories. It concludes with a final quality assurance check to ensure data consistency and completeness across years.
- GIS Optimization: Designed for users who wish to integrate GIS data into Power BI, this notebook builds upon previously developed volunteer code. This notebook focuses on improving data integrity by checking for missing values, enforcing correct data types, and enables manually entered missing information.
- Spreadsheet - Multi-Year Comparison: The final notebook consolidates cleaned records, compares organisation names and service categories across multiple years, and extracts each organisation’s most current name and category. It then generates a comprehensive, structured spreadsheet for downstream analysis and reporting.
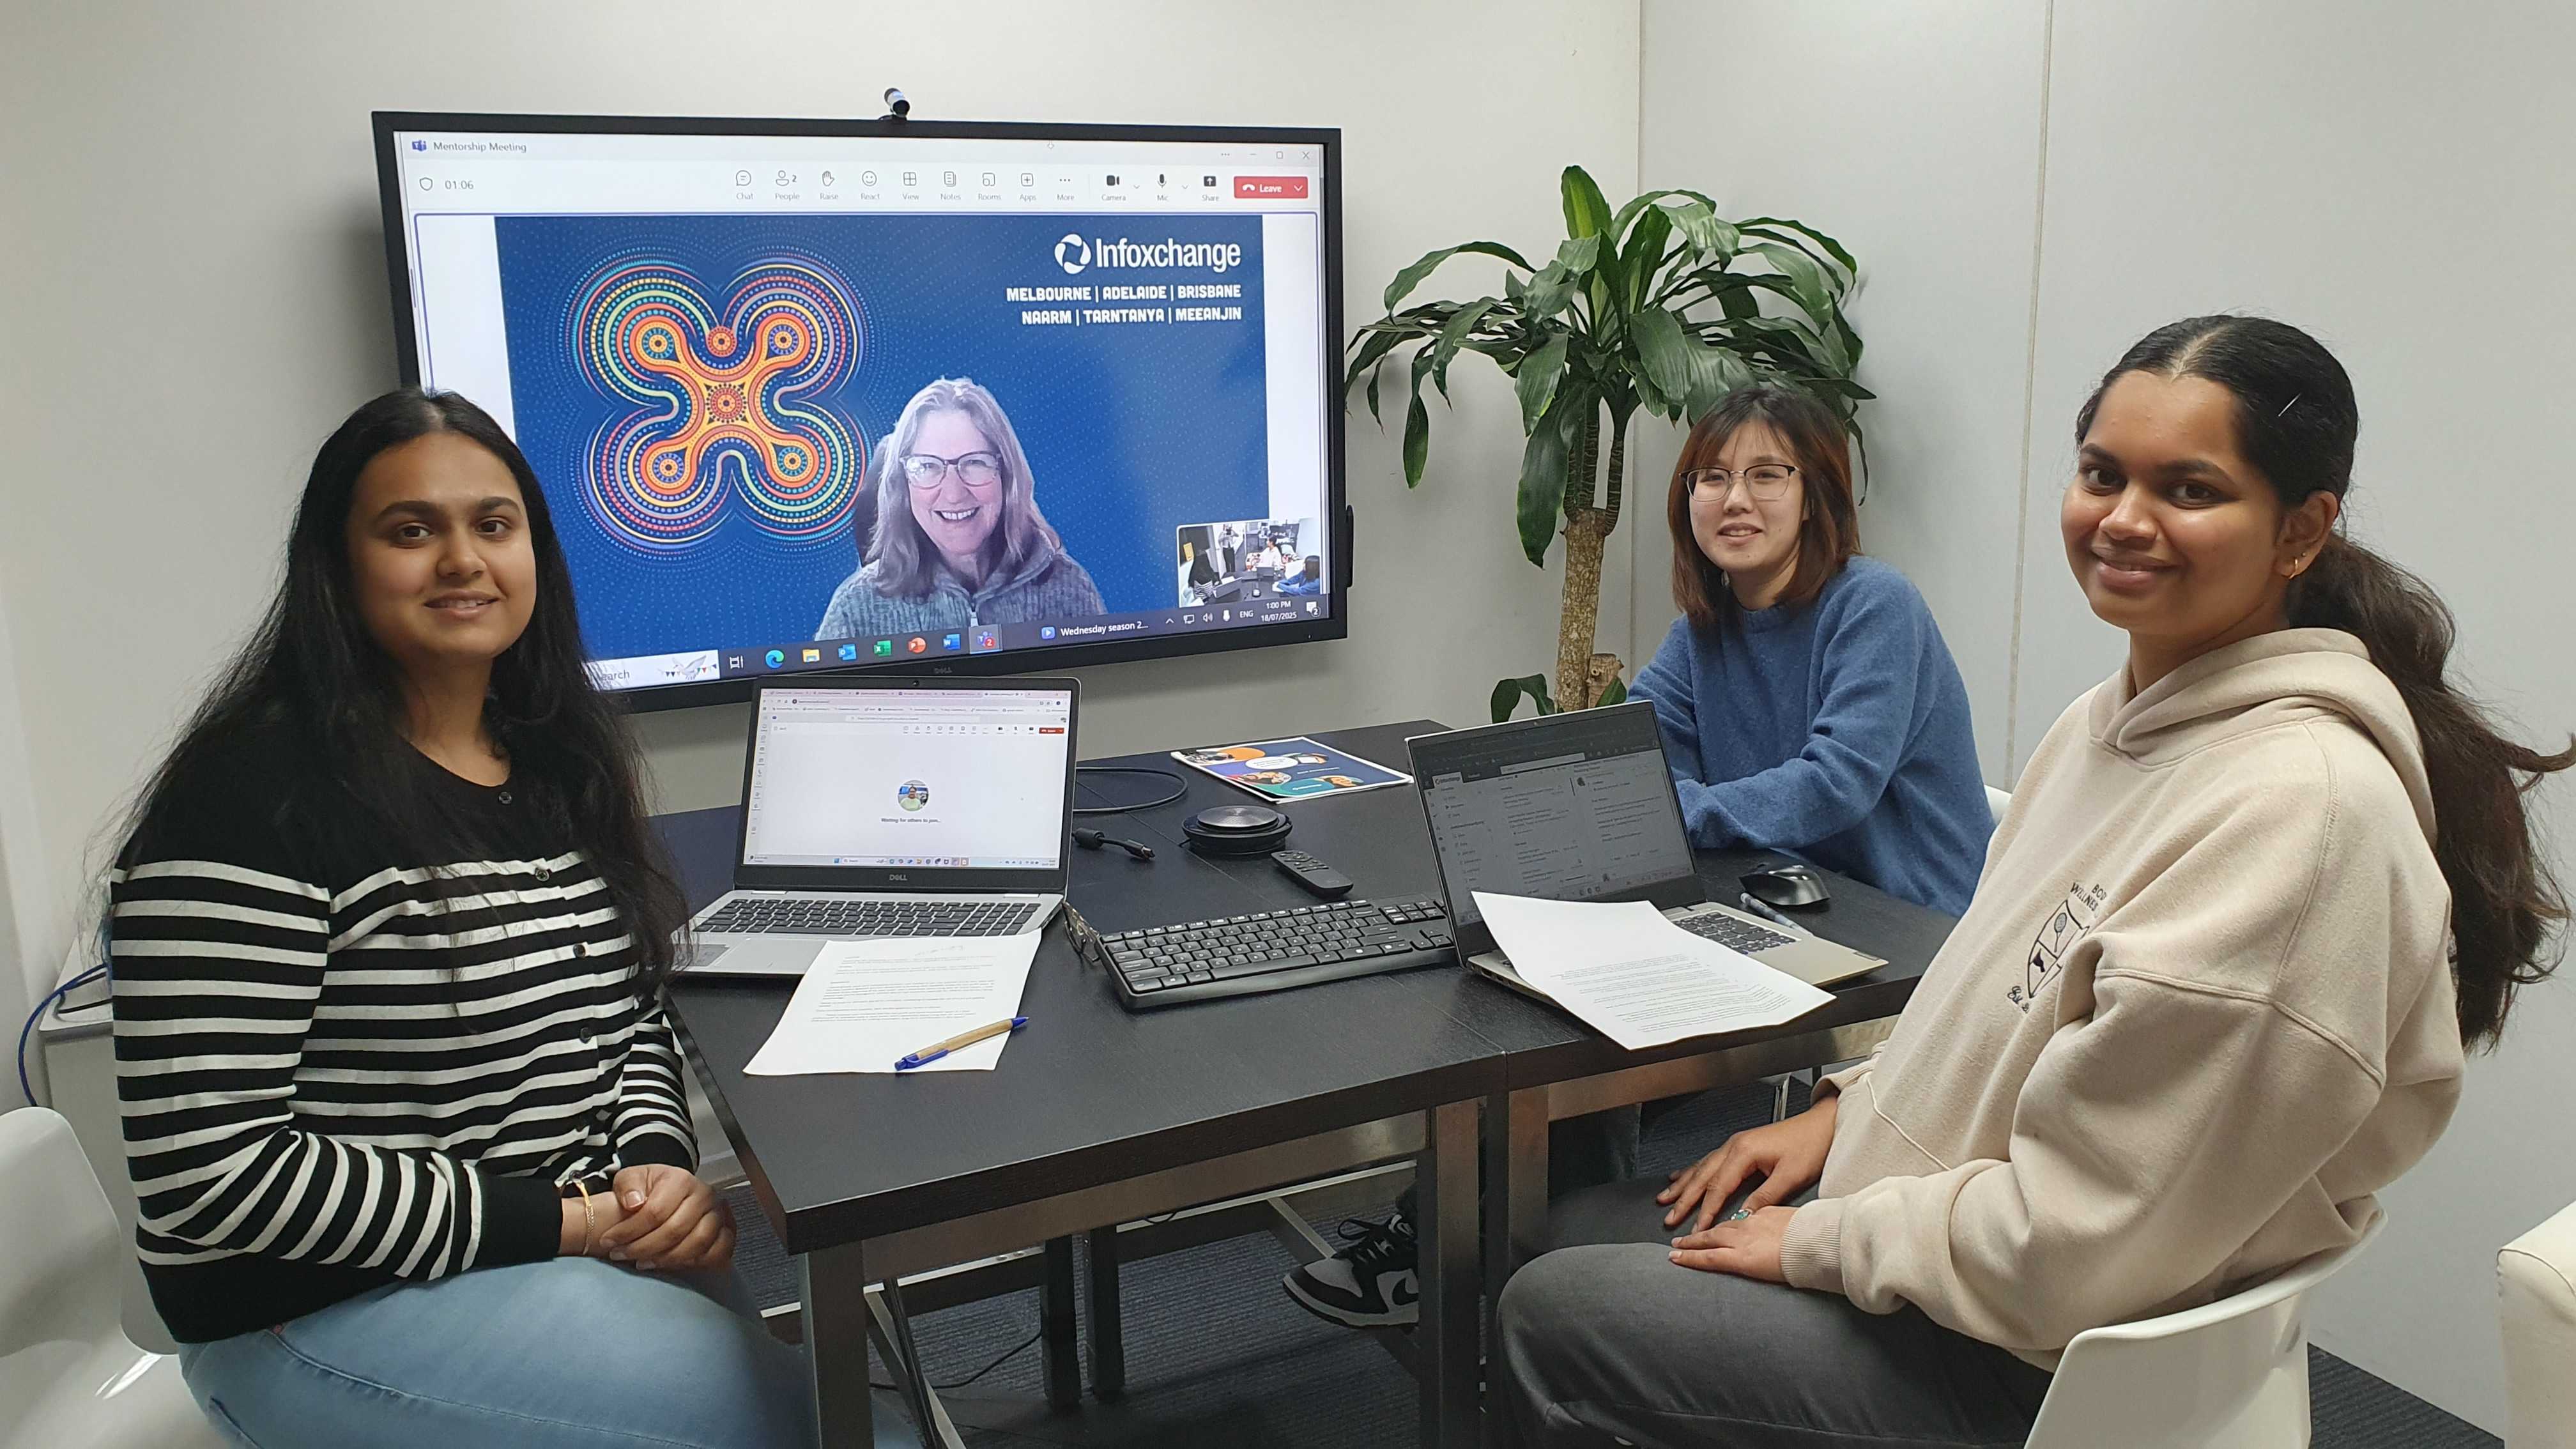 Mentor session with Kristen Moeller-Saxone, joined by interns Meixuan, Deekshitha Podeti and Shrushti Ladage.
Infoxchange Mentor Session
Connecting Up’s mentoring program pairs interns and volunteers with experienced staff at Connecting Up and Infoxchange for career guidance and skill development through informal, half-hour meetings. The program supports interns and volunteers by offering role-specific guidance, building team connections, highlighting relevant training opportunities, and inviting participation in team and social events. This mentorship fosters a developmental partnership, encouraging eager, committed mentees to learn and apply new skills.
Through this initiative, I had the opportunity to connect with Kristen Moeller-Saxone, a Data Capability Lead at Infoxchange (IX) : Products & Services : Digital Transformation Hub. Kristen shared her inspiring career journey, insights into her day-to-day work, and valuable advice for bridging academic Data Science skills with business impact, and pathways into social-impact work:
- Translating Data into Business Decisions: Kristen shared that junior analysts often fixate on tools and models instead of the business problem; for example, she sees great dashboards that never answer the stakeholder’s “so what?”. She suggested always translating findings into a clear decision or action, and learning the basics of data quality, ownership, and governance early.
- Building Toward Strategic/Leadership Roles: Kristen shared that moving up means understanding context, people, and impact—not just code; for example, her own involvement in groups like DAMA and DCN broadened her view beyond analytics. She suggested you build stakeholder skills, project planning chops, and a professional network while still sharpening your technical base.
- Academic pathway to go deeper inside the industry: Advantage or Anchor? Kristen shared from her own experience finishing a PhD that the depth and rigor can help when roles need research-grade thinking; for example, she found the analytical discipline valuable but noticed the publication mindset can slow delivery in business settings. She suggested proving you can ship “good enough” solutions fast and communicate simply, whether or not you pursue a PhD.
- Mindset shift from academia to corporate DS: Kristen shared her own transition story—moving from open-ended, paper-driven work to fast, impact-focused analytics; for example, she had to stop perfecting novel methods and instead reuse reliable ones to meet product deadlines and KPIs. She suggested embracing iteration, aligning with business metrics, and collaborating within real-world constraints as daily habits.
- Entering non-profit/social innovation data work: Kristen shared that her move was driven by mission alignment and seeing data improve real lives; for example, DCN projects showed her how small orgs struggle with data capacity. She suggested starting with volunteering or small pilots, framing impact in measurable terms, and designing solutions nonprofits can maintain.
- Critical skills for helping nonprofits build data capability: Kristen shared that nonprofits need practical “data plumbing” and storytelling more than exotic ML; for example, a clean Power BI report with clear definitions often beats a complex model. She suggested focusing on ETL basics, privacy/ethics, simple impact evaluation methods, and thorough documentation/handovers.
- Communication, Translation & Networking: Kristen shared that being able to translate complex analysis into plain, decision‑ready language—and building relationships so those messages land—is as important as the technical work itself; for example, she described joining the Data Management Association to tap into “webinars and conversations” about “data for business issues” rather than just raw technical content. She suggested data analytical role can practice data storytelling skills, deliberately cultivate a cross‑functional network early, and always check that each deliverable answers a stakeholder’s “so what?”.
- Continuous Learning & Professional Development: Kristen shared from her own career that sustained growth comes from ongoing, community‑based learning beyond any single qualification; for example, she joined DAMA that keep both her technical and business skills sharp. She suggested setting a regular personal‑development cadence—attending events, joining professional associations, and reflecting on project‑level lessons—to ensure your skills stay aligned with the impact you want to make.
This mentoring session with Kristen was incredibly valuable. Hearing about her career path and experiences sharpened my understanding of what it takes to excel as a Data Analyst and motivated me to keep honing my skills and advancing in this field. Her perspective on academic pathways also gave me fresh ideas for connecting with industry and deepening my expertise in new ways.

Infoxchange All Staff Town Hall Meetings 27 May 2025
Great experience attending the all-staff meeting on the first day of the internship at ConnectingUp. The meeting provided essential information about the group’s culture, key work directions, and future development pathways. Through attending the meeting, valuable insights were gained into the organization’s culture and values, operational improvements were learned about, and an understanding of how to deliver customer-centered service effectively was developed. With AI improvements currently emerging, awareness was also gained of the organization’s AI strategies aimed at increasing productivity. This broadened the understanding of AI beyond typical learning tools, highlighting how AI can be integrated into real-world business processes.
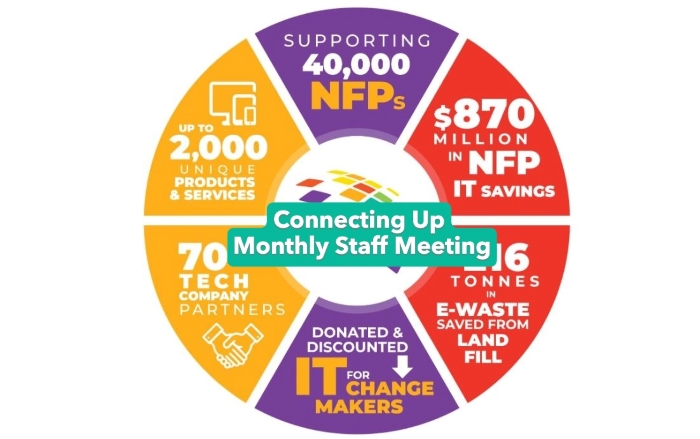
Connecting Up Monthly Meeting 10 June 2025
Since starting as an intern, I have regularly attended monthly staff meetings. These sessions have been a valuable opportunity to listen and learn about Connecting Up’s operations and performance. In my first meeting, I gained insights into how the organisation performed financially at the end of the financial year, upcoming changes to services due to cost adjustments, and progress on the website rebuild. It was an informative introduction to how company meetings are structured and the types of strategic and operational topics typically discussed.
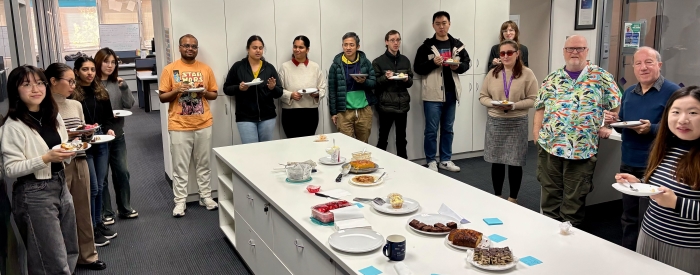
Infoxchange's Biggest Morning Tea - Cancer Council 17 June 2025
Help Cancer Council raise much needed funds that go towards vital cancer research, support services, prevention programs, and advocacy
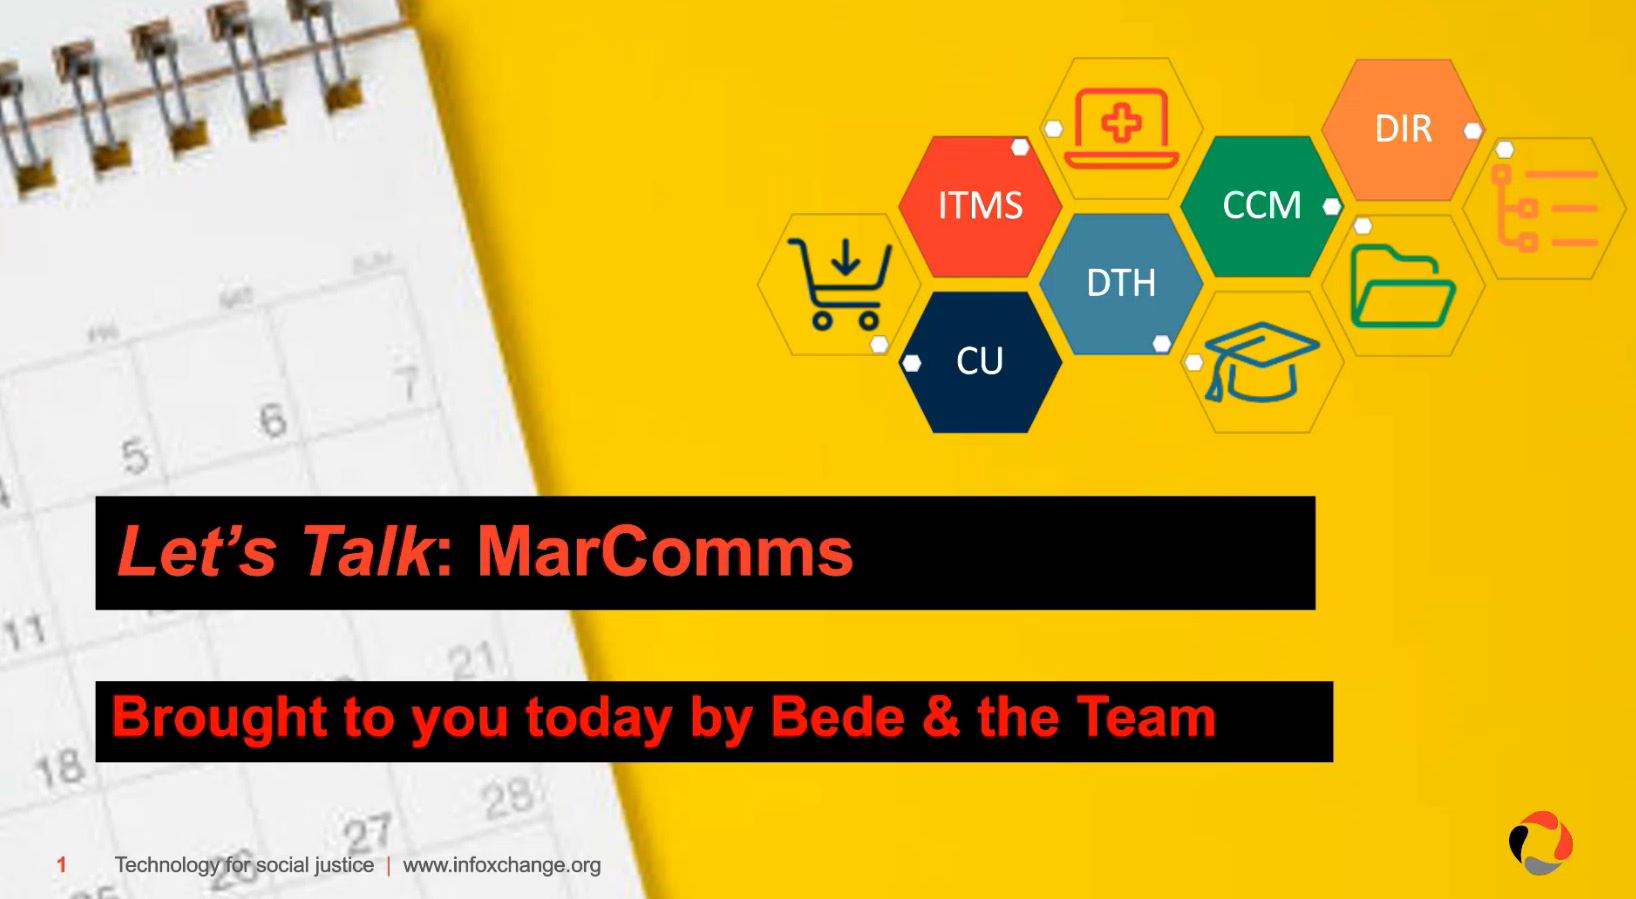
Let's Talk Webinar | Conference Recap & Tech Report (Recording) - 28 May 2025
The agenda included a recap of Tech for Social Justice 2025, which drew 321 registrations at Melbourne’s Telstra Customer Insight Centre; a showcase of nonprofit AI solutions such as the Wombot homelessness-support chatbot and a deforestation-monitoring platform; an overview of internal marketing and communications projects; a review of digital-marketing results, including LinkedIn follower growth and paid-ad performance; a brand-refresh update for the Digital Transformation Hub; and a call to complete the 2025 Digital Technology in the Not-for-Profit Sector survey.
From a data-analytics internship viewpoint, the session illustrated how key event metrics informed practical decisions: tracking the 321 total registrations alongside revenue data supported a tiered pricing strategy—affordable early-bird rates paired with higher full-price tickets—which generated greater ticket income than the previous year; post-event surveys reported 100% of respondents willing to return and a Net Promoter Score of 54; LinkedIn followers grew by about 1000 with strong social-media impressions and organic sharing; and sponsorship revenue increased by 80% after rolling out a targeted prospectus and collaborative outreach. These concrete examples demonstrate how collecting and reviewing core metrics can guide pricing tactics, measure attendee satisfaction, gauge digital reach, and shape partnership strategies.
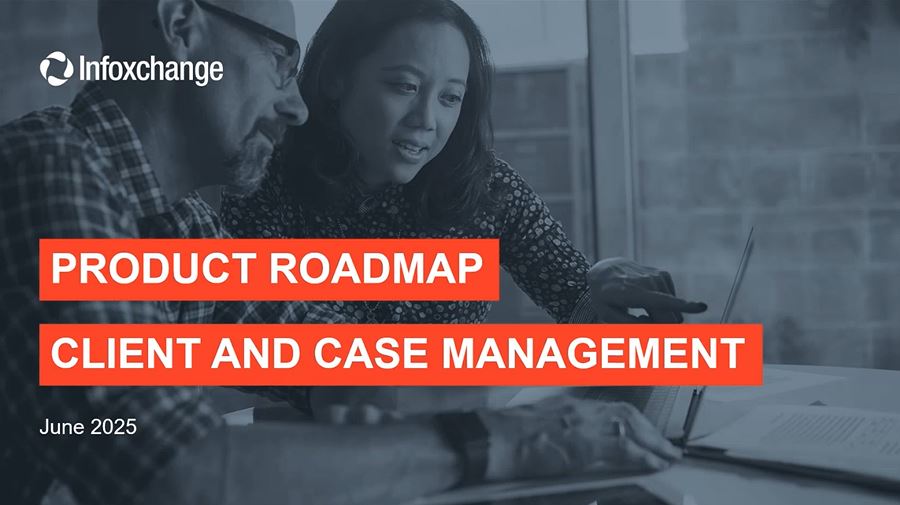
Let's Talk - The Future of Care - A Roadmap for Smarter, More Compassionate Case Management - 24 June 2025
Key Speaker: Brendan James
This Organisational Let's Talk/Lunch & Learn session introduced the roadmap for “smarter, more compassionate” client and case management—highlighting end-to-end improvements such as automating PDF generation, integrating a service directory that lets providers claim and update their own entries, and launching a client portal for real-time queue visibility and self-service data entry (with vulnerability-aware, co-design principles). It also covered security enhancements—including a SharePoint-style file previewer, multi-factor and app-based authentication—the data-warehouse self-service pilot (extended to September with five active participants), and ongoing technical-debt reduction (framework and PHP upgrades) to ensure stability, security, and maintainability.
As a data-analytical intern, I observed the critical importance of clean, synchronized data across systems (Client & Case Management, NetSuite, SRS) for dashboarding, reporting, and analytics, and gained insight into how product strategy, security, and maintenance initiatives directly impact the quality and accessibility of data for both customers and analysts—insights I will apply in future work.
Let's Talk - The Future of Care - Key learnings from the ideas to action projects and what's next - 10 July 2025
Key Speaker: Kristen Moeller-Saxone
Kristen Moeller-Saxone shared how the I2A initiative helps small to medium NFPs build data skills to improve community outcomes. The team plans to work with 20–30 organisations over three years—two are already onboard, and more are in early talks. The focus is on long-term support, not just one-off help. She also mentioned monthly webinars open to all, which help organisations learn and grow together, even if they’re not part of the main project.
Data Catalyst Network (DCN)
The Data Catalyst Network, is a cross-sector collaboration created to enable not-for-profit organisations working to support children, families and communities to use data more effectively to shape services and achieve their outcomes and generate new insights to better disrupt cycles of disadvantage.
Data Catalyst Network Meetings are held monthly and volunteers and interns are invited to attend to understand how nearly 70 organisations are working with data from the not-for-profit community sector alongside academics, government bodies, and business professionals.
Data Catalyst Network Webinar | Social Scope Sector-led Benchmarking Tool 28 May 2025 Deb Tsorbaris, CEO, Centre for Excellence in Child & Family Welfare,
David Poynter, General Manager Business Development & Research Based Models, Anglicare Victoria, and
Dr Bengianni Halil-Pizzirani, Executive Manager, Innovation & Strategy, Centre for Excellence in Child and Family Welfare, Director of Research & Evaluation, Impact Initiative, Co-Founder, Synk.ai.
Key Speaker: Dr Bengianni Halil-Pizzirani
This webinar provided valuable insights on how to effectively apply data analytics in the social services sector, particularly for early intervention work with vulnerable children and families. The session introduced user-centered, bottom-up data solutions and discussed methods to leverage user data for collection purposes. Additionally, the ethical dimensions behind the data and the human stories were emphasized as highly important.
Collaboration and iteration are crucial — the project’s ongoing partnership model and phased implementation demonstrate that continuous collaboration and user feedback are key to optimizing data tools and achieving sustainable impact. Technical skills must be combined with a deep understanding of the context and stakeholder needs.
Data Catalyst Network Webinar | Social Scope Sector-led Benchmarking Tool 28 May 2025
Key Speaker: Kristen Moeller-Saxone & Dr. Jan Kabátek
The webinar showed how not-for-profit organizations can leverage comprehensive, linked administrative datasets, including hospital admissions, school enrollments and child-protection records to uncover patterns of disadvantage and employment trajectories at a population level across Queensland, South Australia and Victoria. It also explained how co-design methodologies bring multiple agencies together around a common research question and demonstrated the role of strong data-sharing agreements and human-in-the-loop validation in safeguarding privacy and analytical quality. Finally, the session introduced three AI-driven HILDA tools streamlining the path from question to insight.
Several insights emerged for using AI models throughout the data-analytical process. Defining upfront which tasks and questions you’ll ask the model ensures focus and shared clarity. Feeding it linked, population-level data can unlock system-wide patterns—but only after establishing rigorous governance, airtight sharing agreements and privacy safeguards to prevent leaks. Careful model selection is also vital; off-the-shelf commercial tools may be convenient but might not suit not-for-profit needs or data sensitivities. AI assistants can then accelerate variable selection, exploratory analysis and code generation, yet human review must validate outputs and catch errors. Finally, mapping data sources, choosing appropriate communication modes and streamlining workflows keeps AI-augmented pipelines efficient, secure and aligned with all partners.
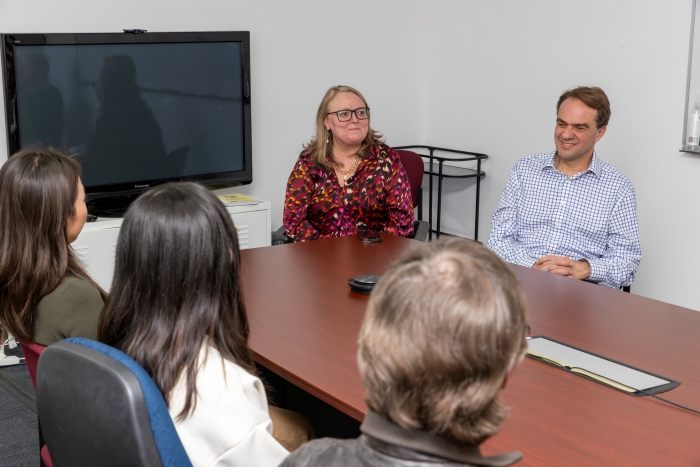
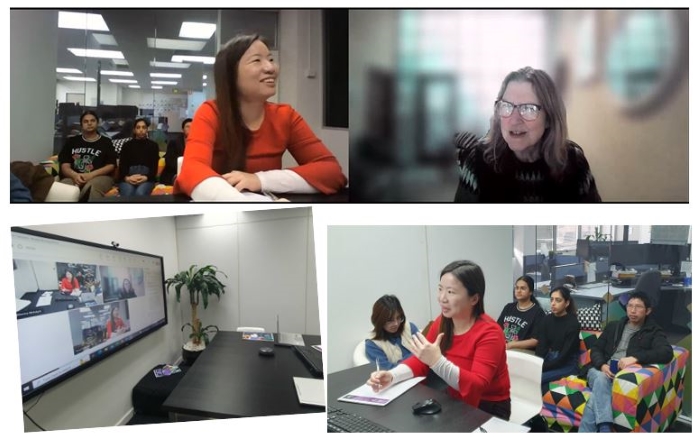 Photo taken during a workshop session between Kristen Moeller-Saxone, Data Capability Lead at Infoxchange, and Yong Kheng Beh on 27 June 2025 with Interns invited to attend.
Infoxchange Jo Davies COO and David Spriggs CEO Visit 25 July 2025
Jo Davies COO and David Spriggs CEO from the Melbourne Office flew to Adelaide for a Q&A Staff (and Intern) Meeting to discuss organisation-wide strategic directions before participating in an informal shared lunch with staff and interns.
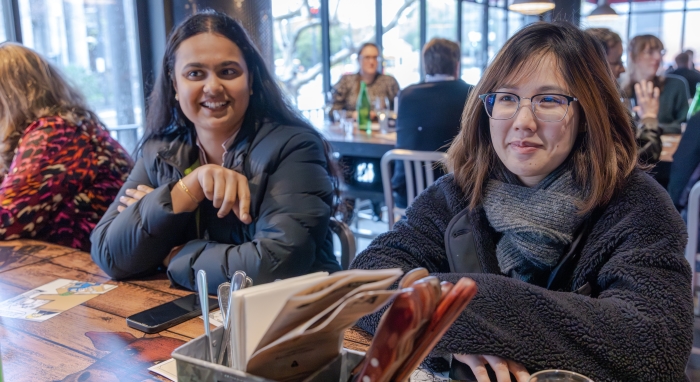
Jo Davies COO, Interns Deekshitha Podeti and Meixuan Liao at the IX Lunch 25 July 2025
Digital Training & Development
Volunteers and interns have access to the Connecting Up Digital Learning Platform, which offers live and recorded webinars, workshops, and webcons led by subject-matter experts on various technology topics relevant to the not-for-profit sector. Meixuan selected, attended, summarized, and evaluated relevant training sessions to explore how they could enhance her volunteer experience:
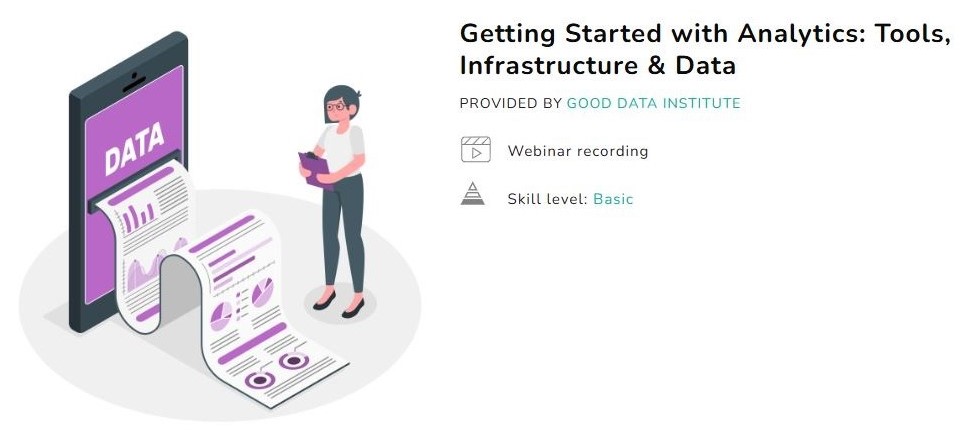
CU Webinar: Getting Started with Analytics: Tools, Infrastructure & Data
Vivek Katial, Co-Founder and Executive Director, Good Data Institute &
Kristen Moeller-Saxone, Data Capability Lead, Infoxchange
This webinar was selected to gain practical insights into the foundational aspects of data management within not-for-profit organizations. The focus on bridging the gap between theoretical knowledge and real-world application was particularly relevant for enhancing data analytics capabilities in resource-limited environments. The session explored the data project lifecycle, emphasizing the importance of clearly defined objectives, effective data collection, data cleaning, and ethical considerations.
Skills developed included strategies for managing messy data, applying data validation and conditional formatting in spreadsheets, and automating data workflows. There was also increased understanding of ethical data handling and how to communicate data insights effectively to non-technical stakeholders.The learning experience reinforced the necessity of a structured approach to data projects, starting from alignment with organizational goals through to actionable insights. It provided practical tools and frameworks that support data hygiene and collaboration in not-for-profit settings.
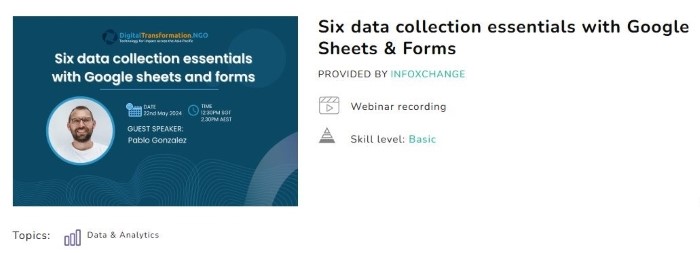
CU Webinar: Six data collection essentials with Google Sheets & Forms (Recording)
Chosen for its focus on essential, accessible tools—Google Sheets and Google Forms—that improve data collection and analysis skills. Led by an experienced instructor, the session offered practical, hands-on learning to enhance data management. Since Excel is commonly used, learning these new tools adds valuable skills.
Covered foundational skills in Google Sheets, including quick creation of charts and tables, smart functions like currency formatting and dropdowns, organizing financial data with categories, and dynamic data visualization. For Google Forms, the webinar covered form design, survey structure, extracting summary statistics, and detailed response review. Practical exercises reinforced these skills.
Gained valuable expertise in organizing, visualizing, and analyzing data efficiently. Developed skills to design effective surveys and interpret results, supporting systematic data collection and basic statistical analysis. These abilities are useful for future data analytics work, enabling faster insights and better decision-making
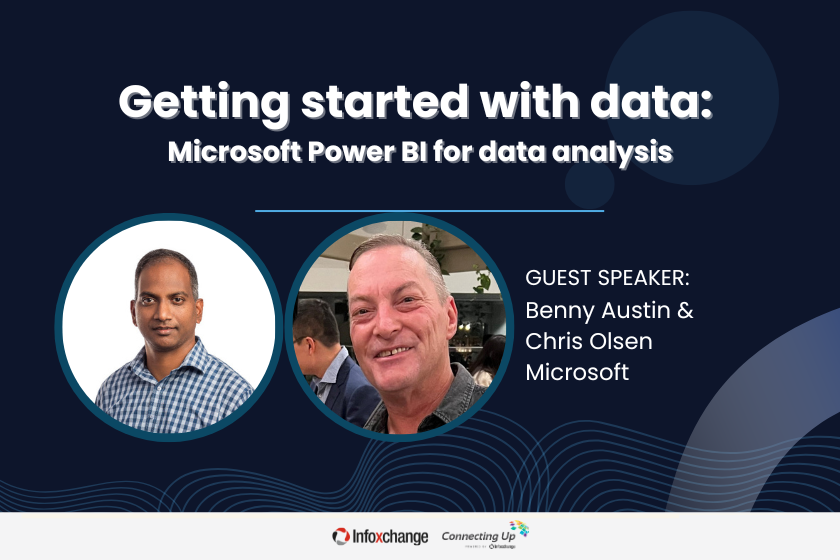
CU Webinar: Getting started with data: Microsoft Power BI for data analysis (Recording)
Power BI stands out for its intuitive interface, seamless integration with various data sources, and powerful DAX formulas—making it an ideal tool for transforming raw data into clear, interactive dashboards. The webinar covered key skills across the full reporting workflow:
- Data Connection & Transformation: Imported data from Excel, SQL, and APIs, then cleaned and reshaped it using Power Query.
- Visual Design: Created charts, tables, maps, and KPIs with best-practice layouts and interactive features.
- Data Modeling & Calculations: Defined relationships, hierarchies, and DAX measures such as year-over-year growth and running totals.
- Sharing & Automation: Published reports to the Power BI service, implemented row-level security, and scheduled automatic data refreshes.
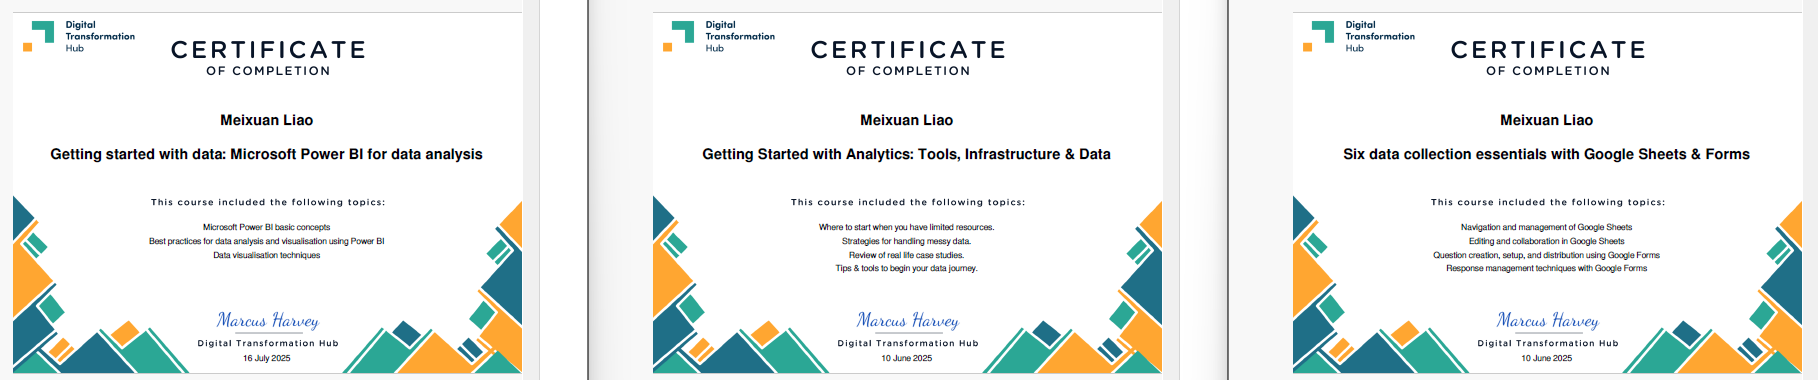 Three webinar certificates received
Hands-on exercises guided participants through the entire report creation process—from data ingestion to building a polished executive dashboard. Features like bookmarks and tooltips were used to enhance storytelling. By the end of the session, participants were equipped to build insightful, audience-ready dashboards and automate updates—enabling faster, data-driven decision-making.
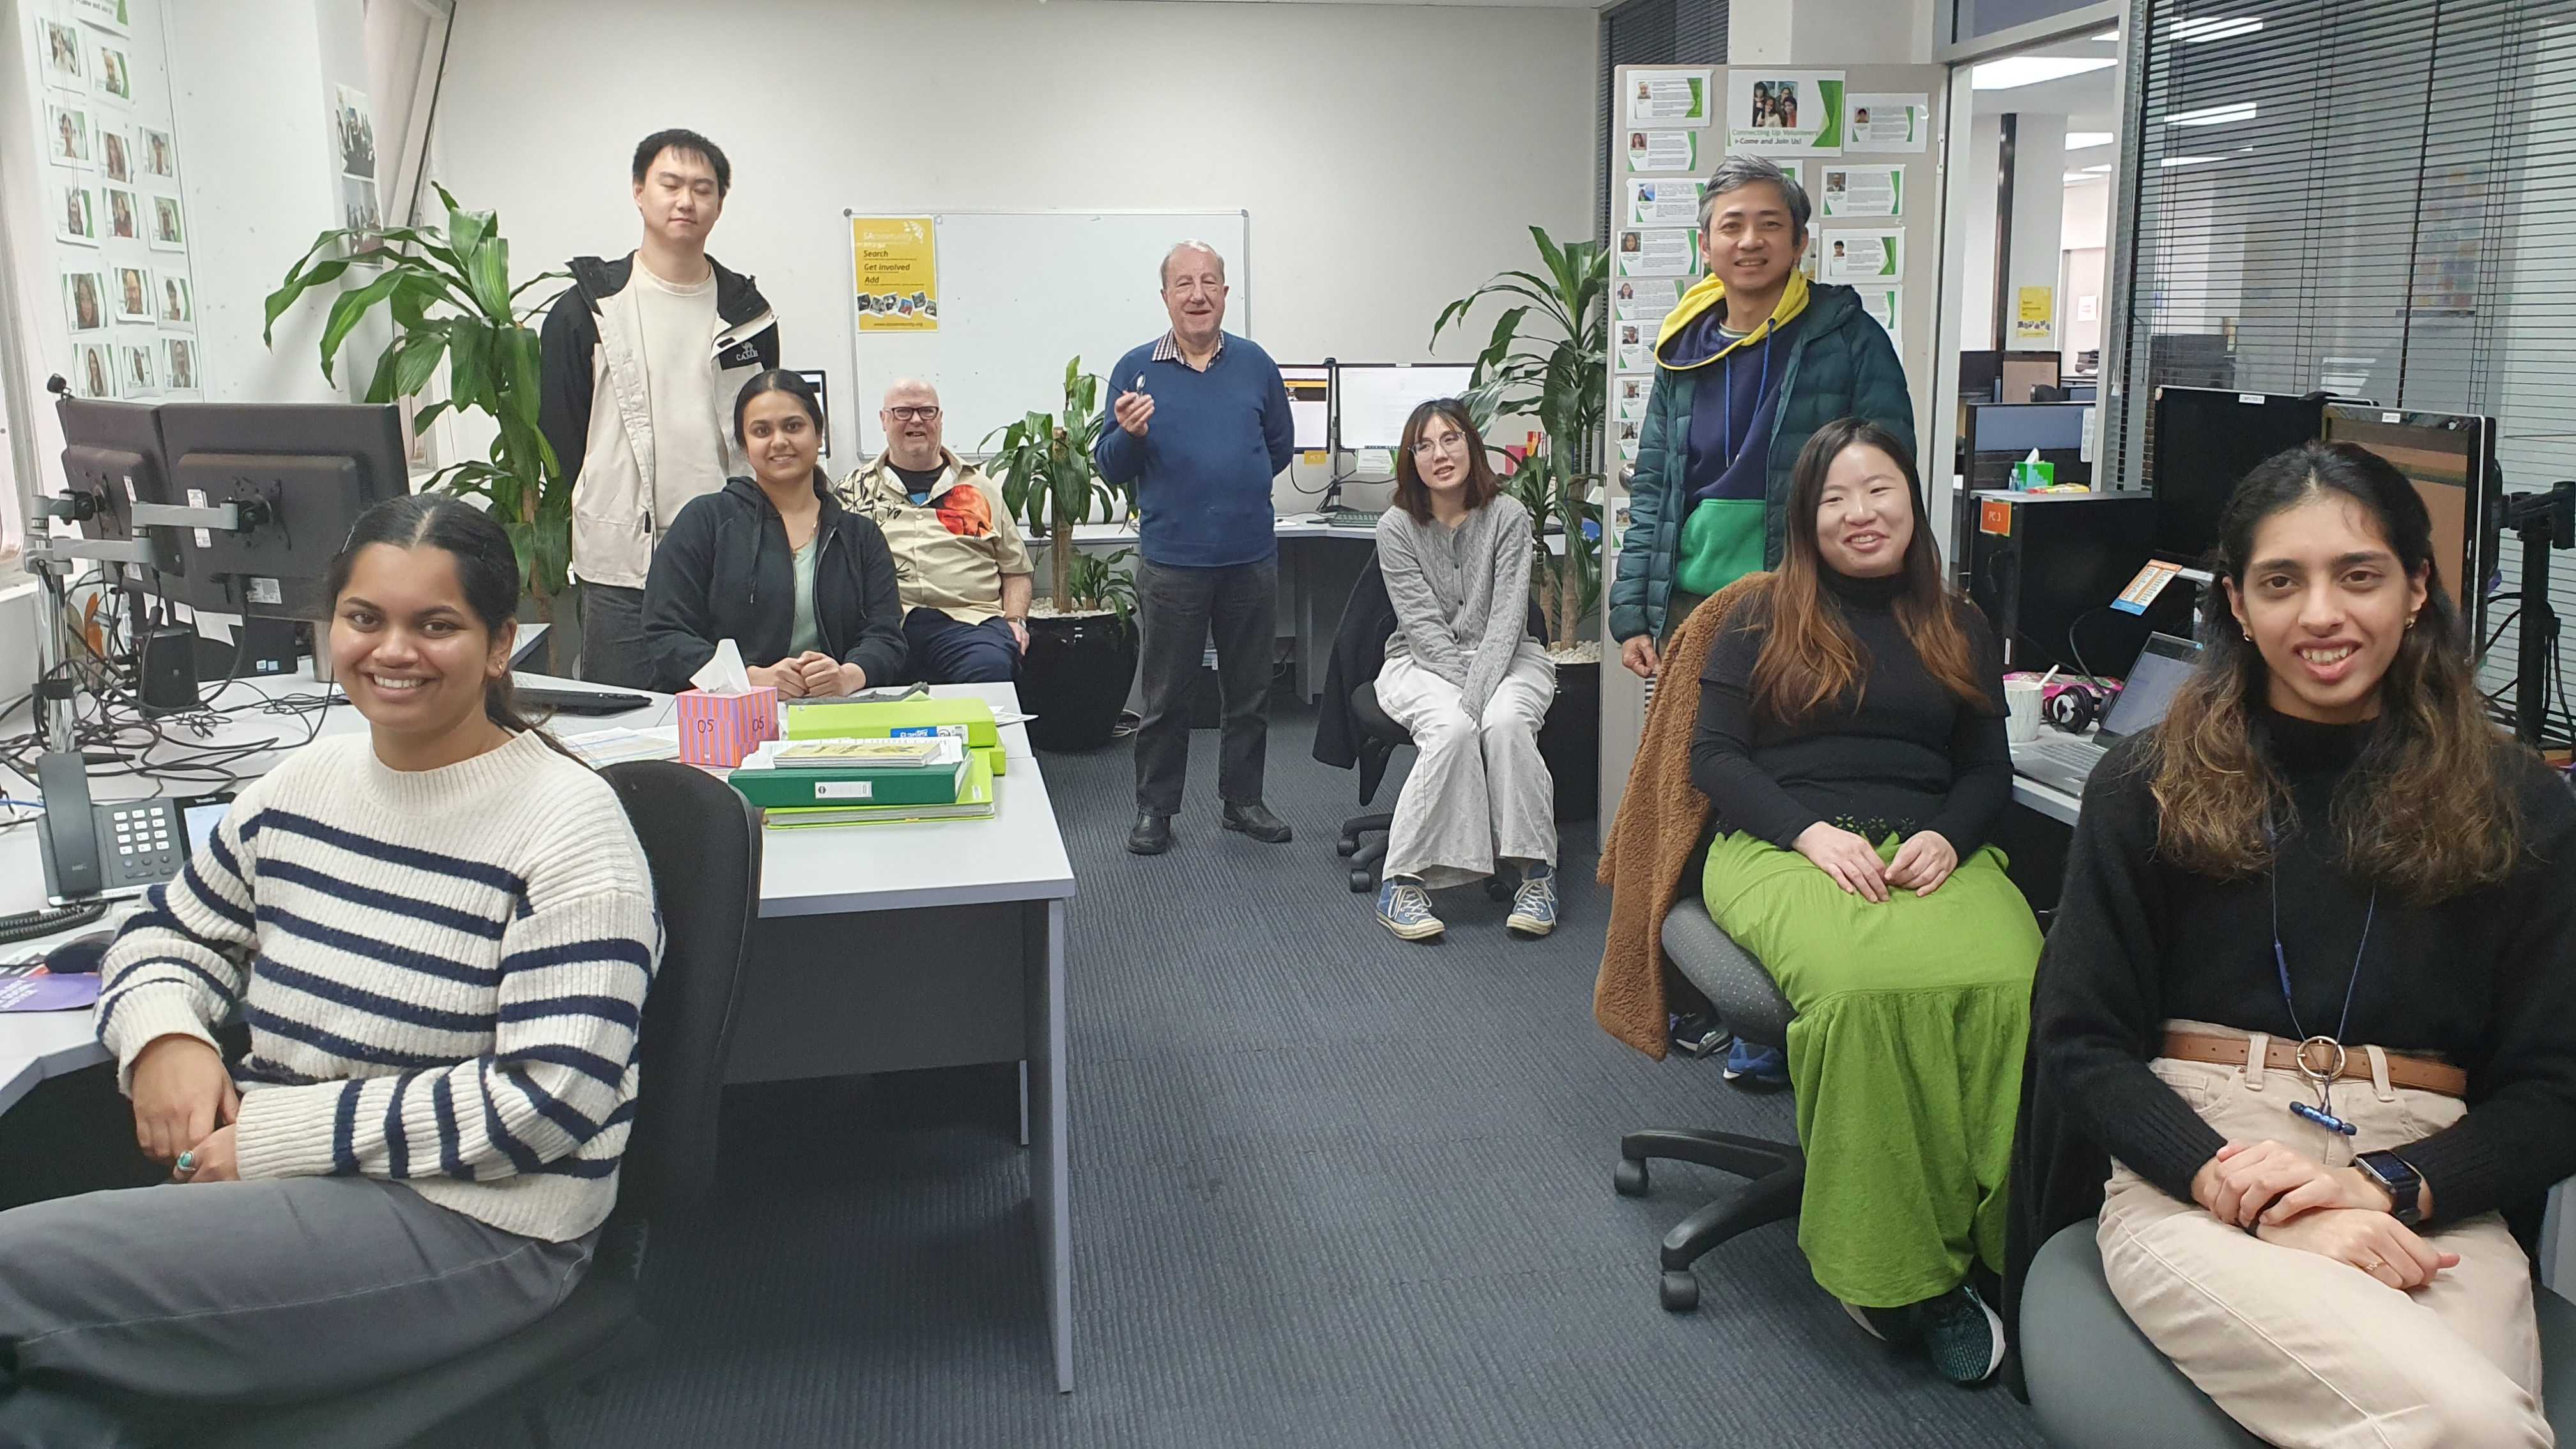 Photo with SAcommunity people and volunteers: Stathis, Rex, Joe, Robert, Yong Kheng, and interns Deekshitha, Charmi, and Shrushti
Reflection
My time at SAcommunity was a rewarding and eye-opening experience. I had the chance to work on the Community Service Statistics project, where I used Power BI to visualize service data for the City of Tea Tree Gully and designed infographics to make the insights easy to understand for everyone, not just data experts. I also helped not-for-profit organizations keep their listings up to date on the SAcommunity directory. Communicating with them via phone and email taught me the importance of accuracy and clear communication.
Through capacity-building sessions, I introduced new interns to the SAcommunity program and shared my approach to cleaning council data with my peers. I also improved Python scripts for data validation and GIS mapping, which helped me grow technically and think more critically about data quality. One of the highlights was a mentoring session with Kristen Moeller-Saxone from Infoxchange. Her advice on turning data into real-world decisions and working in the social impact space gave me a clearer sense of direction for my career.
Overall, this internship helped me build confidence, sharpen my skills, and confirmed my passion for using data to make a difference in the community. I learned how to turn raw information into meaningful insights that can guide real decisions, especially in the not-for-profit space. Working to understand councils and service providers showed me the real-world impact of thoughtful data analysis—how it can improve access to services, highlight community needs, and support better planning.
 Meeting and Lunch with David Spriggs CEO and Jo Davies COO of Infoxchange (Melbourne) at Infoxchange Adelaide Office with staff and interns 25 July 2025
