![]()
![]()
![]()
The Power BI “Data Bridge”: Automating SAcommunity Council Reporting

One of the most rewarding projects I’ve worked on at SAcommunity has been building a Python‑based automation pipeline for our council reporting. What began as an attempt to reduce repetitive manual work has grown into a reliable, end‑to‑end process that anyone on the team can run.
This “Data Bridge” script automatically prepares a clean dataset ready to import directly into Power BI, no manual cleaning, matching, or cross‑referencing required.
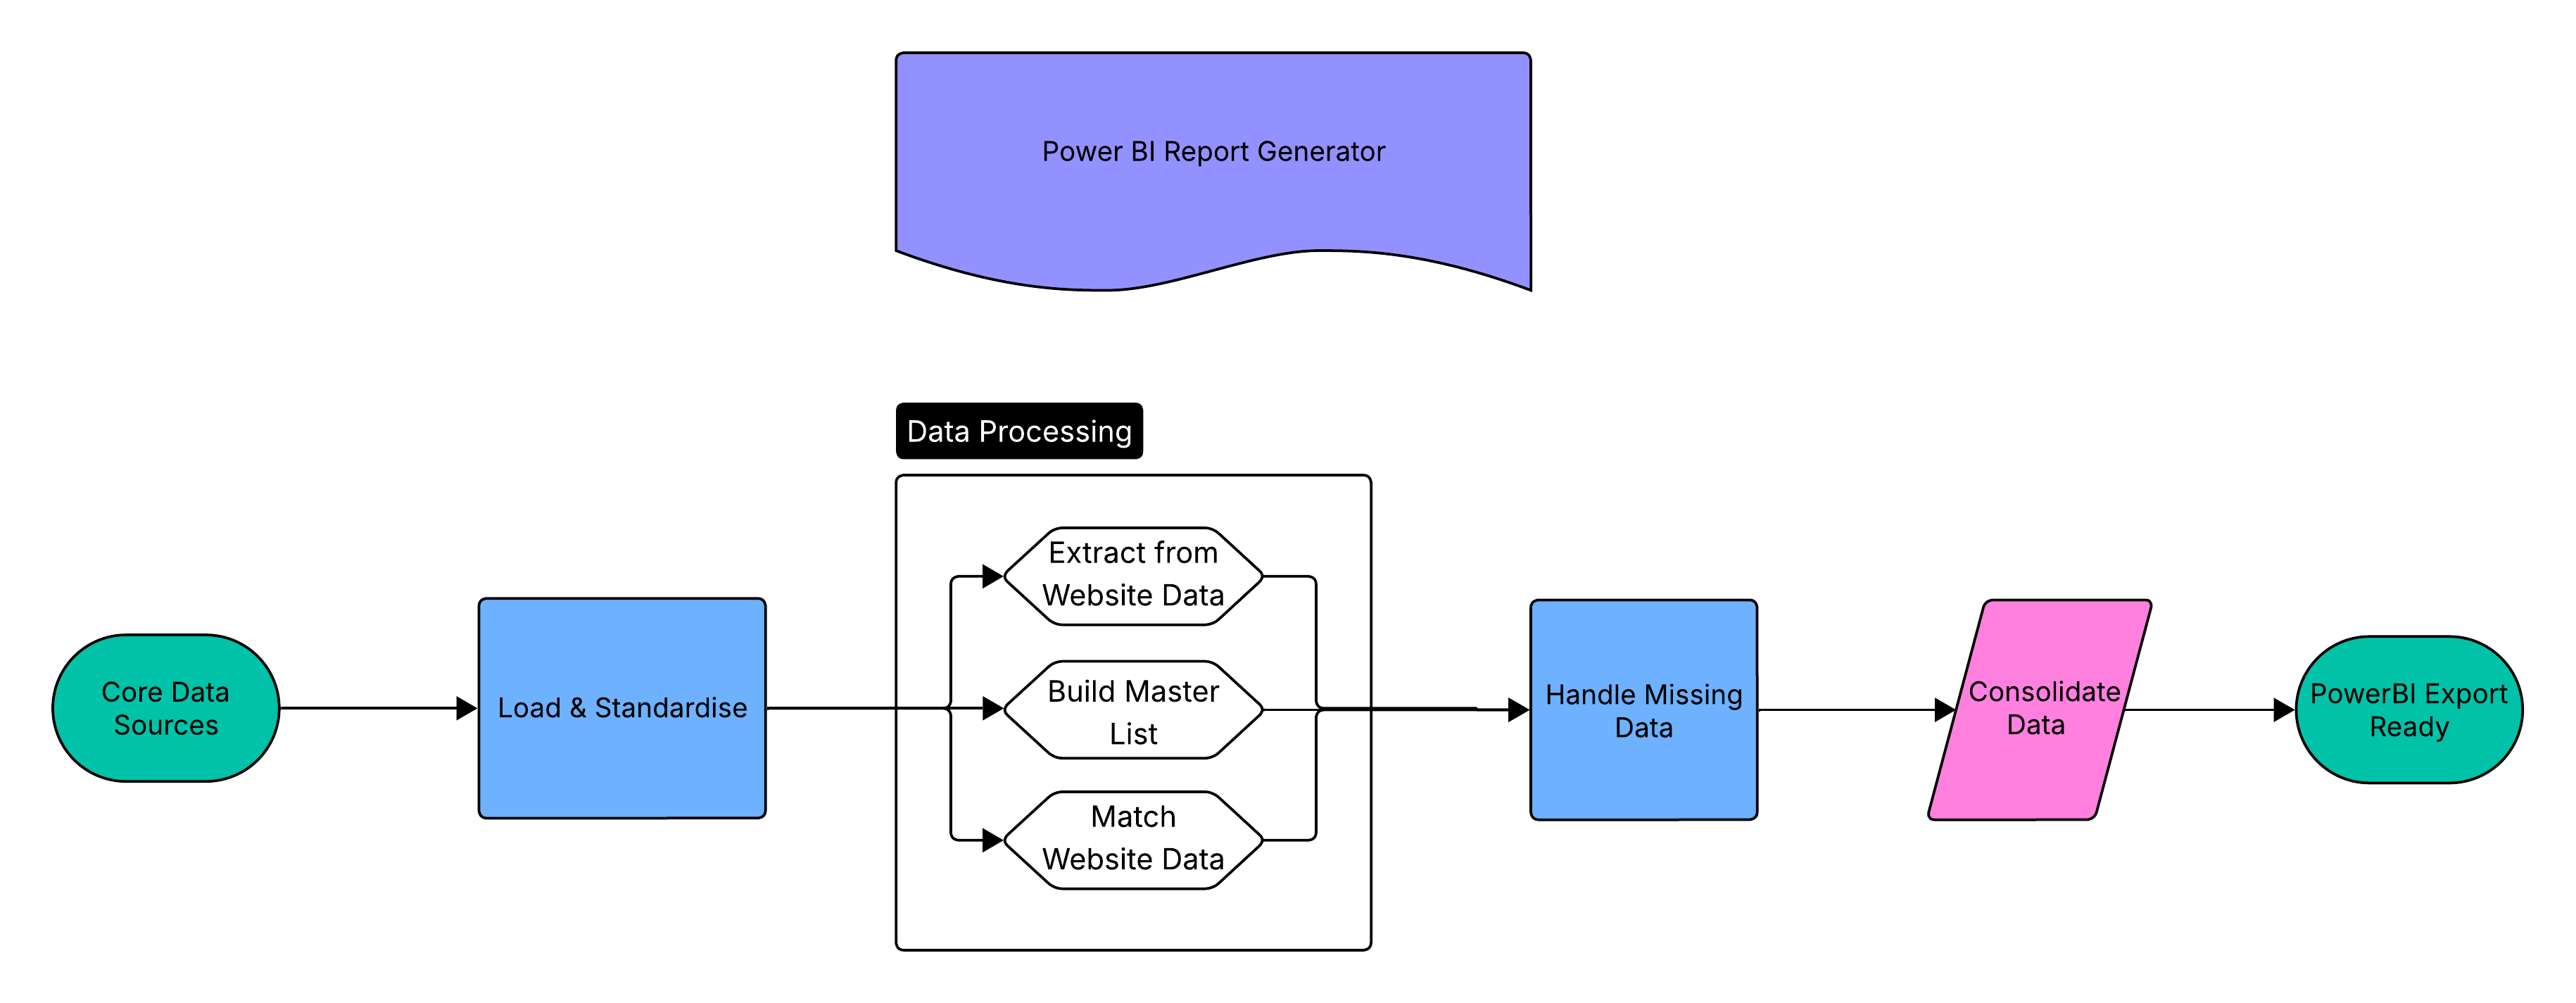
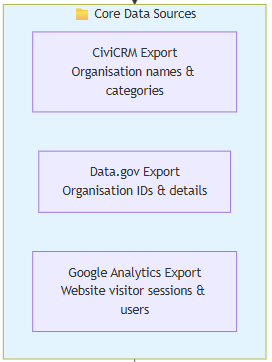
Previously, producing council reports meant juggling information from three separate data sources:
- CiviCRM — organisation names and categories
- Data.gov.au — organisation IDs and basic details
- Google Analytics — website session data
Manually stitching these together was slow and error‑prone. Each export used slightly different terminology and formatting, which meant anyone preparing the reports had to remember a surprising amount of detail about file quirks and column names.
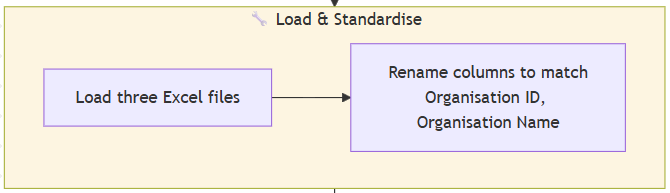
1. Standardising Language Across All Files
Each source uses different column names for the same concept.
For example, CiviCRM uses “Internal Contact ID” while Data.gov uses “Organisation ID” while other sources use different labels. The script automatically aligns these fields upfront so everything matches cleanly downstream.
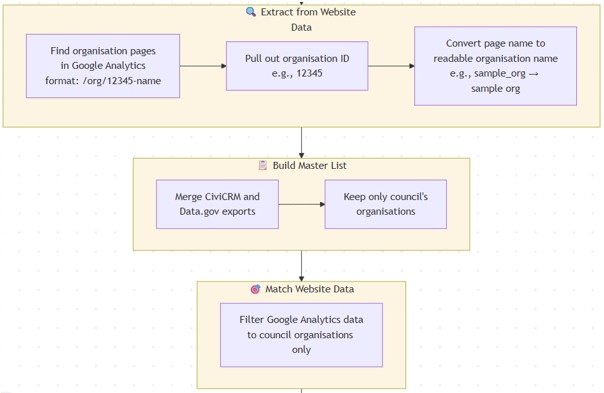
2. Converting Google Analytics URL Paths and Creating a Unified Master Organisation List
Next, the script tackles what I found to be one of the more interesting challenges: extracting useful information from Google Analytics URL paths.
Google Analytics doesn’t store organisation names — only URL paths like:
1 /org/12345-meals_on_wheels
The script extracts:
- The organisation ID
- A readable version of the organisation name
This allows session data to attach correctly to each organisation.
From there, the script builds a master list of all organisations associatedThis master list becomes the backbone of the entire report. The Google Analytics data is then filtered against it, so only relevant organisations make it through. with the council by merging CiviCRM and Data.gov on their shared organisation ID.
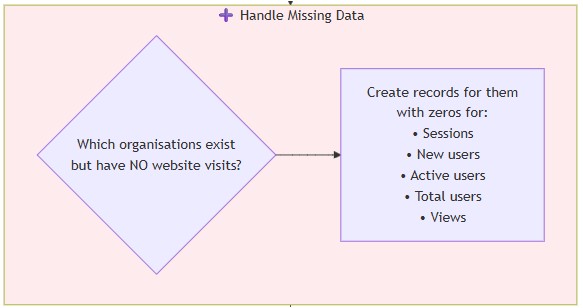
3. Including Organisations with No Web Activity
A key improvement is ensuring every organisation appears in the final output, even if it received zero sessions. No silent exclusions. No missing rows. Every council service is represented, whether it has a thousand visitors or none. That completeness matters enormously when presenting to council stakeholders who need to understand the full landscape of community services in their area not just the popular ones.
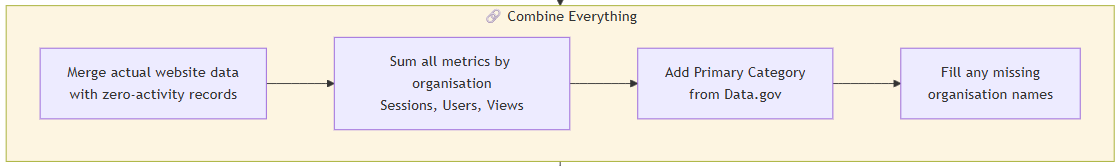
4. Final Output: Clean, Power‑BI‑Ready Data
The output is a single clean Excel file ready to load straight into Power BI without any further cleanup.
The script:
- Sums all metrics per organisation
- Sorts the dataset by session count
- Adds Primary Category information from Data.gov.au
Accuracy, Efficiency, and What This Means for the Team
By removing manual steps, the Data Bridge turns a previously complex workflow into a reliable, repeatable process. It ensures the numbers we present to councils are clean, consistent, and trustworthy and it frees our team to focus on insights rather than data wrangling.
This pipeline improves:
Accuracy - Manual merging often produced small inconsistencies. Automation guarantees consistent logic every time.
Completeness - Even organisations with no activity are represented, giving councils a true picture of where attention or promotional support may be needed.
Efficiency - Because setup is minimal, report generation no longer depends on a single person’s institutional knowledge. Anyone can run it.
