Outback Communities Authority
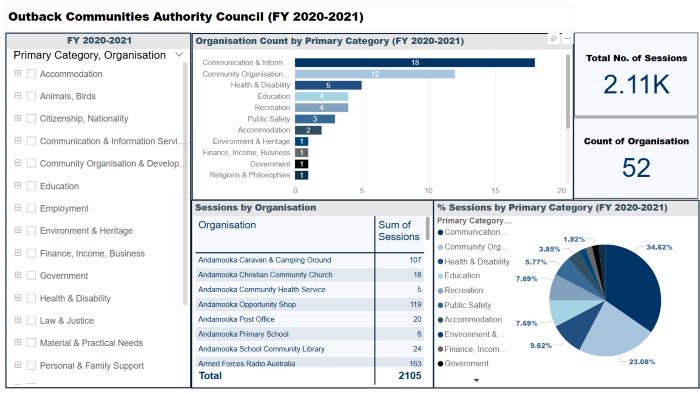
Outback Communities Authority Council Data Analytics FY 2020-2021
Outback Communities Authority Analytics Overview FY 2020-2021 - Canva - PDF
Outback Communities Authority Analytics Overview FY 2020-2021 - Power BI Export - PDF
Outback Communities Authority Analytics Overview FY 2020-2021 - Power BI Embedded Report (Interactive Public)
~Prepared by Volunteer Todd Guanhua Tao
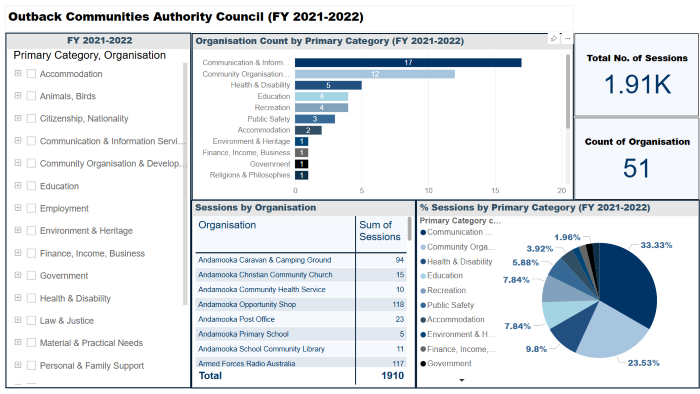
Outback Communities Authority Council Data Analytics FY 2021-2022
Outback Communities Authority Analytics Overview FY 2021-2022 - Canva - PDF
Outback Communities Authority Analytics Overview FY 2021-2022 - Power BI Export - PDF
Outback Communities Authority Analytics Overview FY 2021-2022 - Power BI Embedded Report (Interactive Public)
~Prepared by Volunteer Todd Guanhua Tao
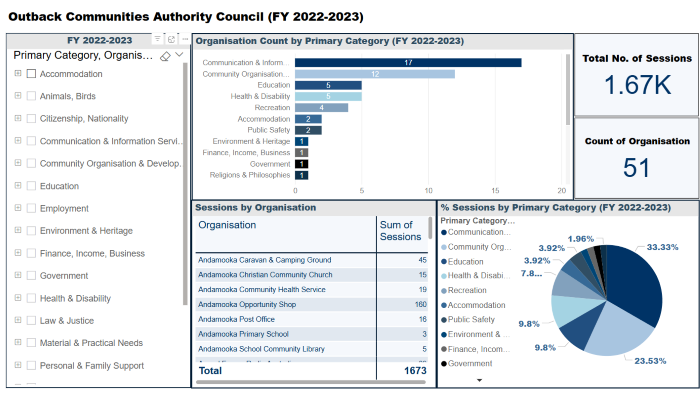
Outback Communities Authority Council Data Analytics FY 2022-2023
Outback Communities Authority Analytics Overview FY 2022-2023 - Canva - PDF
Outback Communities Authority Analytics Overview FY 2022-2023 - Power BI Export - PDF
Outback Communities Authority Analytics Overview FY 2022-2023 - Power BI Embedded Report (Interactive Public)
~Prepared by Volunteer Todd Guanhua Tao
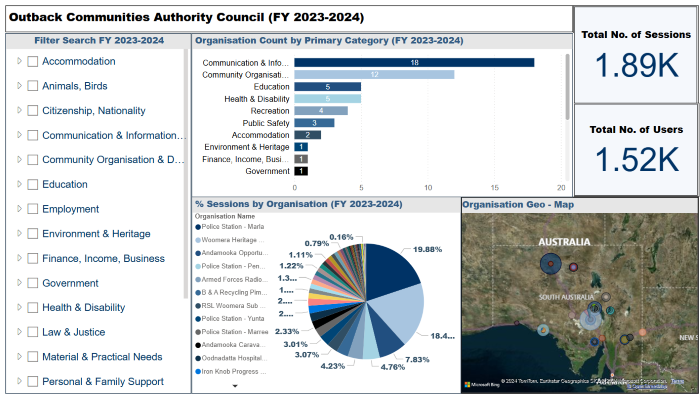
Outback Communities Authority Council Data Analytics FY 2023-2024
Outback Communities Authority Analytics Overview FY 2023-2024 - Canva - PDF
Outback Communities Authority Analytics Overview FY 2023-2024 - Power BI Export - PDF
Outback Communities Authority Analytics Overview FY 2023-2024 - Power BI Embedded Report (Interactive Public)
~Prepared by Volunteer Todd Guanhua Tao
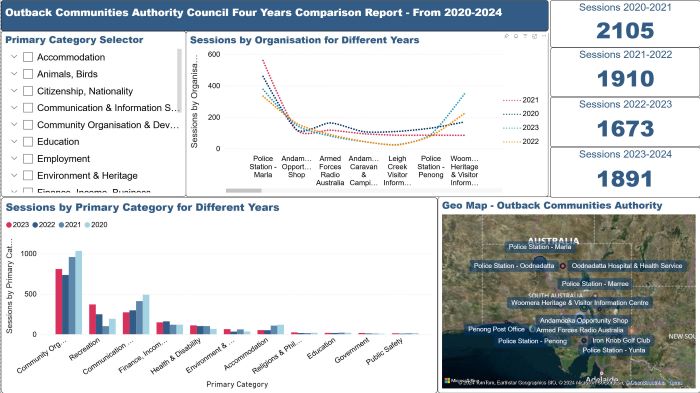
Outback Communities Authority Council Comparison Reports of Last Four Financial Years
Outback Communities Authority Comparison Report of Last 4 Financial Years - Power BI Export - PDF
Outback Communities Authority Comparison Report of Last 4 Financial Years - Power BI Embedded Report (Interactive Public)
~Prepared by Volunteer Todd Guanhua Tao
Reports Insights
The Outback Community Authority (OCA) individual reports and the comparison reports for the past four financial years indicate two levels of insights: primary category level and organizational level. These insights may provide useful inspiration for the development of the OCA Council.
1. Primary Category level:
- Key Takeaway One: Over the four years, sessions from the categories of Community Organization & Development, Recreation, and Communication & Information Services consistently ranked among the top three.
- Key Takeaway Two: For the Community Organization & Development category, the Sankey chart shows that it contributed the most to the sessions across all four years. However, the bar chart in the comparison report indicates a decreasing trend from 2020 to 2023.
- Key Takeaway Three: In the Recreation category, the bar chart reveals that the number of sessions peaked at 370 in 2023. Over the four fiscal years, it exhibited fluctuations without a discernible pattern.
- Key Takeaway Four: Regarding the Communication & Information Services category, there is a decreasing trend, with the highest number of sessions at 490 in FY 2020-2021 and the lowest at 272 in FY 2023-2024.
- Key Takeaway Five: Beyond these categories, sessions for Education, Government, and Public Safety contributed minimally to the total number of sessions in all years.
2. Organizational level:
- Key Takeaway One: At the organizational level, the Police Station - Marla consistently recorded the highest number of sessions across the four financial years, with a peak of 559 sessions in 2021 and a low of 333 sessions in 2022. This indicates that it remains the most visited organization over the analyzed period.
- Key Takeaway Two: The Woomera Heritage & Visitor Information Center ranked as the second most frequently visited organization, achieving its highest session count of 349 in 2023, reflecting a stable interest among visitors.
- Key Takeaway Three: There is a sharp drop-off in session counts between the second most visited organization, Woomera Heritage & Visitor Information Center, and subsequent organizations. Specifically, the third-ranking Armed Forces Radio Australia shows nearly half the session count compared to Police Station - Marla. Beyond the third rank, session counts among organizations show a more gradual decline, indicating a long-tail distribution of visitor engagement.
Sign up for the newsletter!
Subscribe to our monthly newsletter to receive news, information and events for the community sector in SA.


