![]()
![]()
![]()
Southern Mallee District Council
Southern Mallee District Council Data Analytics FY 2020-2021
Southern Mallee Analytics Overview FY 2020-2021 - Canva - PDF
Southern Mallee Analytics Overview FY 2020-2021 - Power BI Export - PDF
Southern Mallee Analytics Overview FY 2020-2021 - Power BI Embedded Report (Interactive Public)
~Prepared by Intern Tanvi Srivastava
Southern Mallee District Council Data Analytics FY 2021-2022
Southern Mallee Analytics Overview FY 2021-2022 - Canva - PDF
Southern Mallee Analytics Overview FY 2021-2022 - Power BI Export - PDF
Southern Mallee Analytics Overview FY 2021-2022 - Power BI Embedded Report (Interactive Public)
~Prepared by Intern Tanvi Srivastava
Southern Mallee District Council Data Analytics FY 2022-2023
Southern Mallee Analytics Overview FY 2022-2023 - Canva - PDF
Southern Mallee Analytics Overview FY 2022-2023 - Power BI Export - PDF
Southern Mallee Analytics Overview FY 2022-2023 - Power BI Embedded Report (Interactive Public)
~Prepared by Intern Tanvi Srivastava
Southern Mallee District Council - Comparison of the Last 3 Financial Years
~ Prepared by Intern Tanvi Srivastava
3 Year Comparison Report - Insights
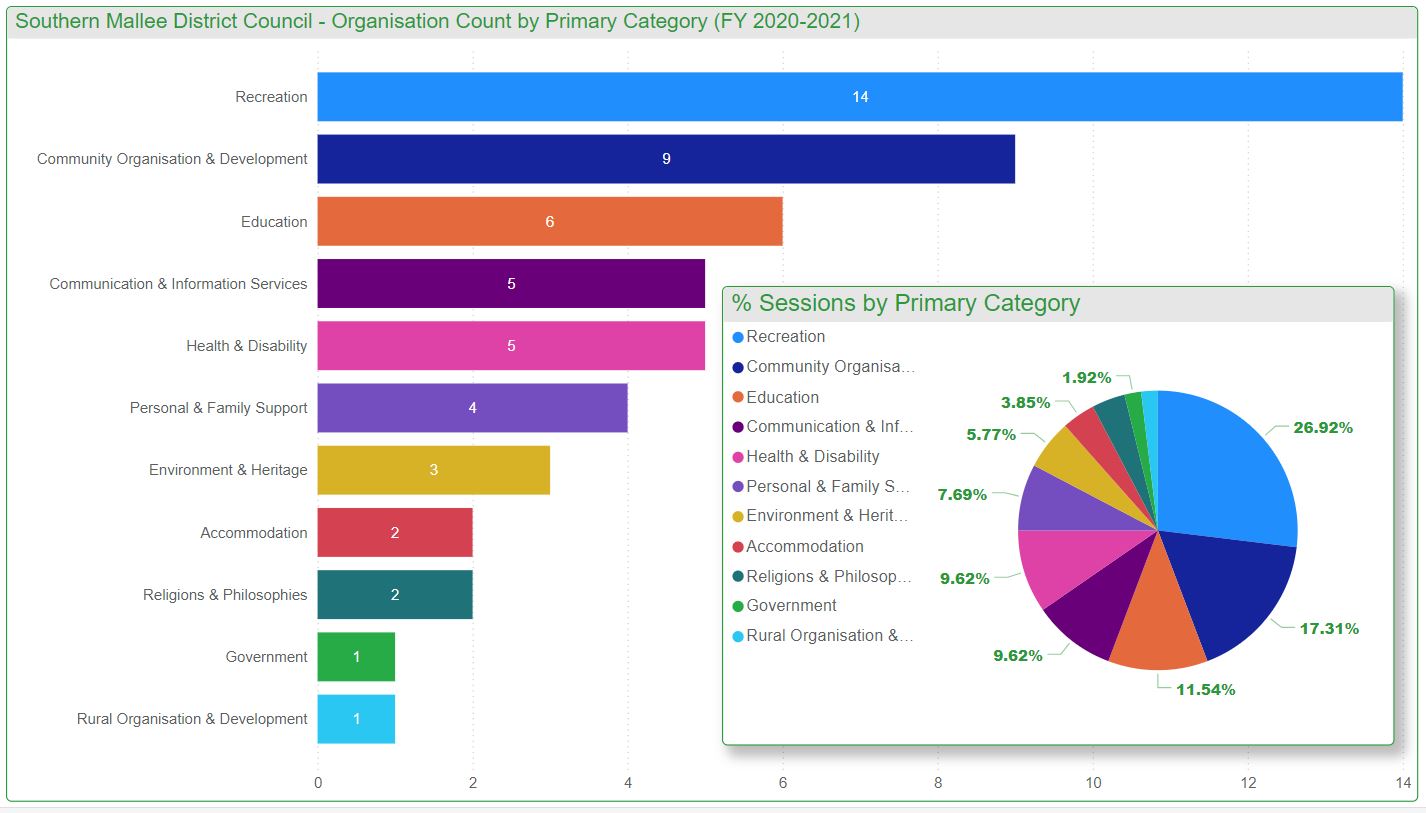
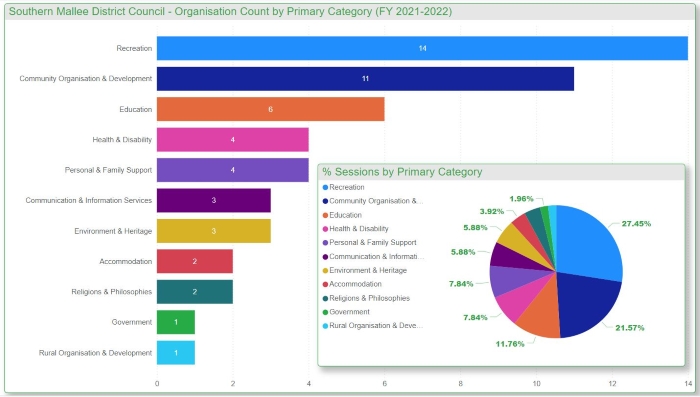
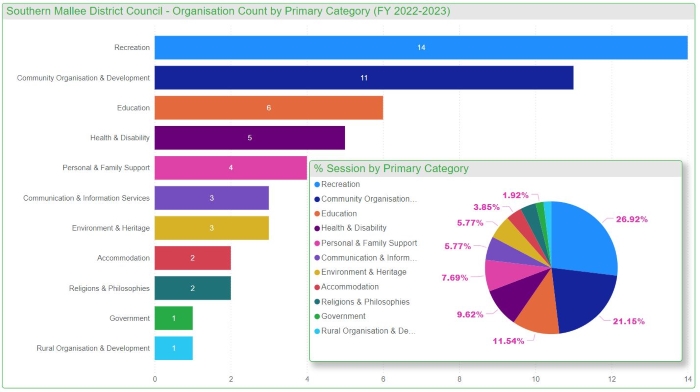
Sessions by Primary Category
Analyzing the individual reports and the reports for the past 3 financial years, we gather that Community Organisation & Development is the most searched Primary Category for the Southern Mallee District Council making up approximately 49% of the total searches in the last financial year with Recreation following and making up 20% of all searches last year.
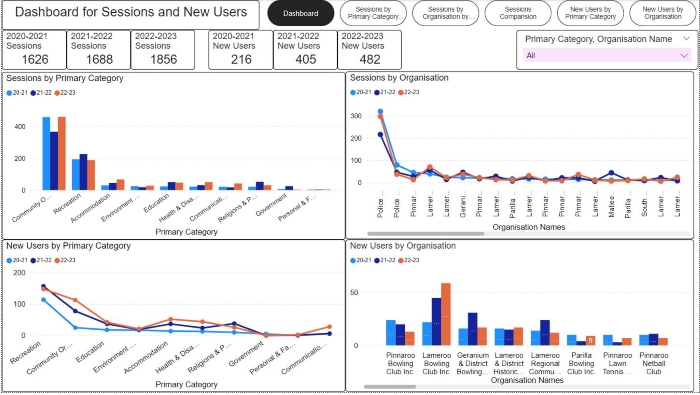
Sessions by Organisation
Lameroo Police Station has consistently been the most searched organisation with about 30% of all searches in finanical year 2022-2023 being for the police station. This is emulated in previous years with 25% of all searches in 2021-2022 and 40% of searches in 2020-2021. Furthermore, Pinnaroo Bowling Club Inc. and Lameroo Bowling Club Inc. are the next two most searched organisations with Lameroo Bowling Club being the most searched in 2022-2023 and 2021-2022 and Pinnaroo Bowling Club being the most searched in 2020-2021.
New Users by Primary Category
The Primary Category of Recreation has consistently garnered the most new users over the past 3 financial years. Approximately 30% of all new users in 2022-2023, 38% of all new users in 2021-2022, and 52% of all new users in 2020-2021 all joined organisations in the Recreation Primary Category. Community Organisation and Development and Education are the next two Primary Categories with the most new users whereas the Government Primary Category has consistently had no new users for the past 2 financial years.
New Users by Organisation
The number of overall new users has consistently grown over the last 3 financial years going from 216 new users in 2020-2021 to 405 new users in 2021-2022 and finally 482 new users in 2022-2023. Lameroo Bowling Club Inc. garnered the highest number of new users in the last two financial years with 12% of all new users joining them in 2022-2023 and 11% of all new users joining them in 2021-2022. Pinnaroo Bowling Club Inc. had the most new users in Southern Mallee in 2020-2021 with 11% of all new users joining them. Sing Australia - Lameroo has consistenly has 0 new users over the last three years and most organisations have shown an increase in number of new users post COVID-19.
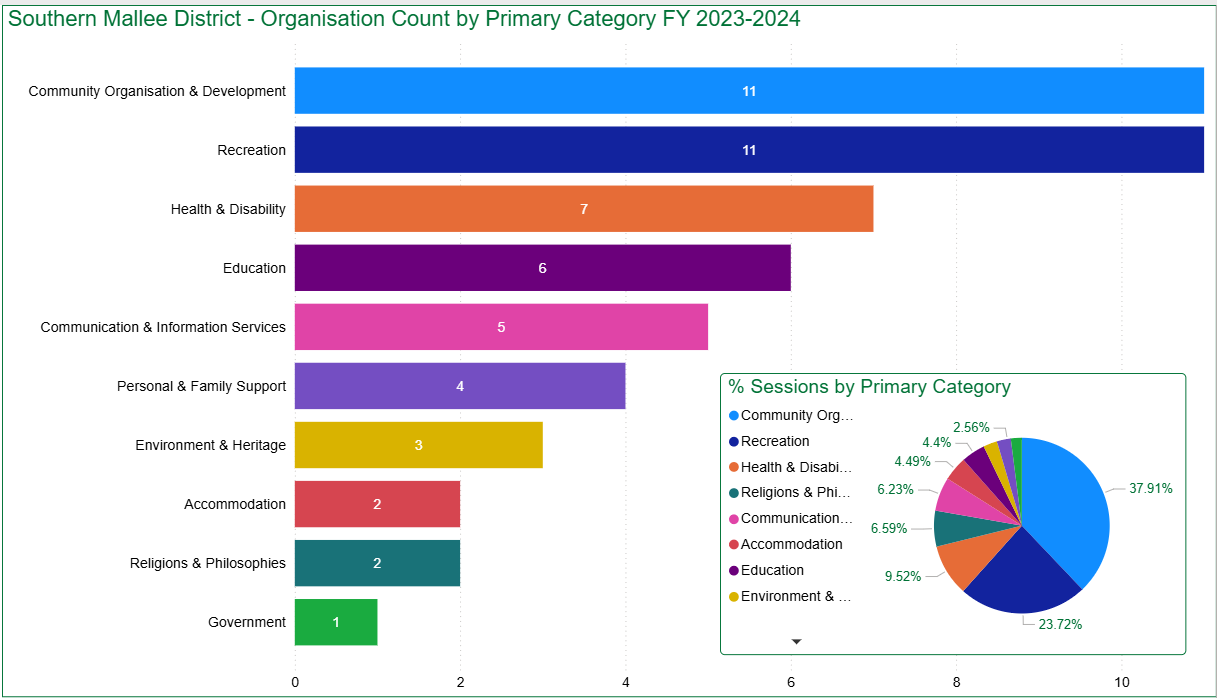
Southern Mallee District Council Data Analytics FY 2023-2024
Southern Mallee District Council Analytics Overview FY 2023-2024- Canva - PDF
Southern Mallee District Council Analytics Overview FY 2023-2024 - Power BI Export - PDF
Southern Mallee District Council Analytics Overview FY 2023-2024 - Power BI Embedded Report (Interactive Public)
~Prepared by Intern Deekshitha Goud Podeti
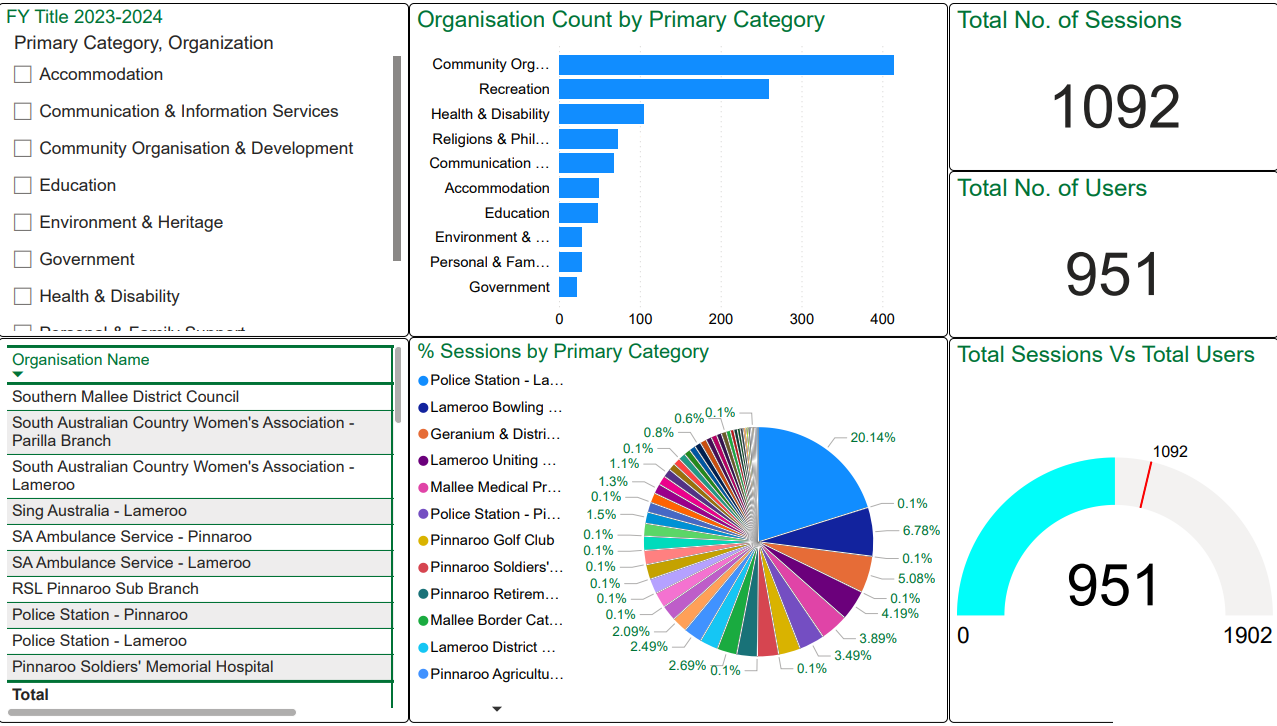
Southern Mallee District Council Data Analytics FY 2023-2024 Dashboard
Southern Mallee District Council Analytics Dashboard FY 2023-2024 - Power BI Embedded Report (Interactive Public)
Southern Mallee District Council Analytics Dashboard FY 2023-2024 - Power BI Export - PDF
~Prepared by Intern Deekshitha Goud Podeti
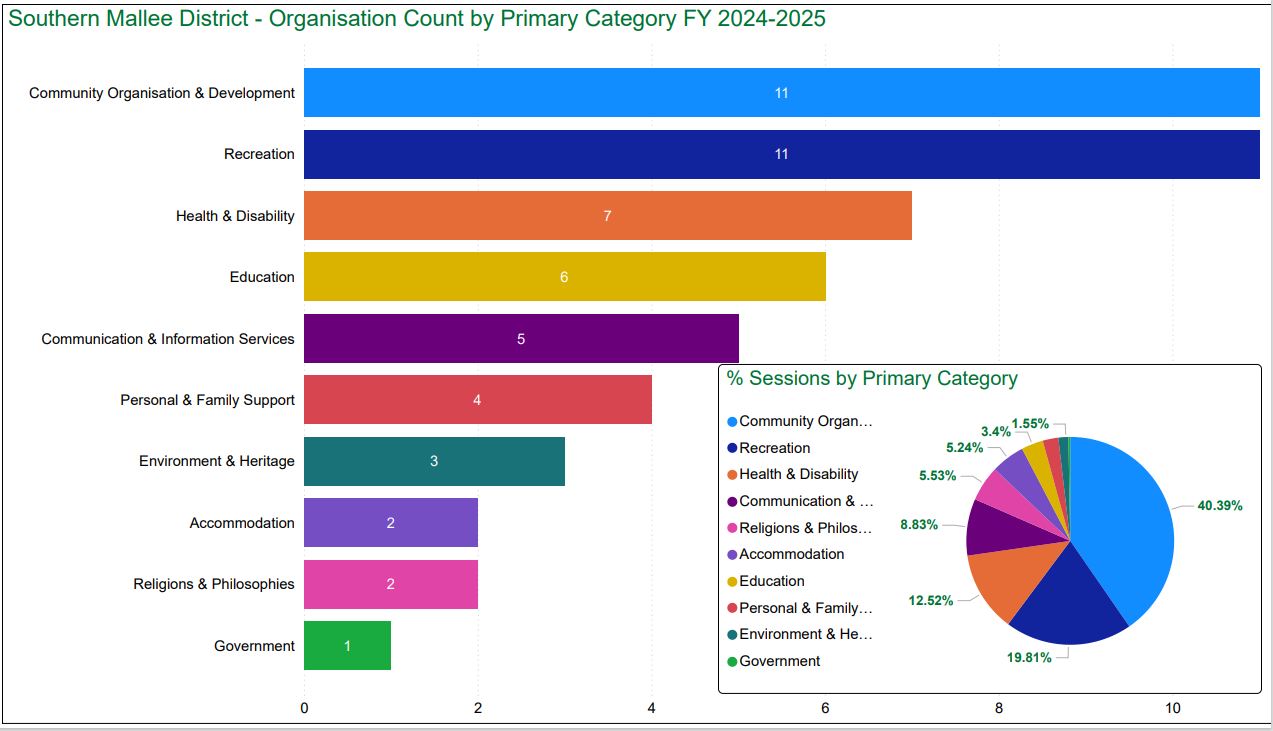
Southern Mallee District Council Data Analytics FY 2024-2025
Southern Mallee District Council Analytics Overview FY 2024-2025 - Canva - PDF
Southern Mallee District Council Analytics Overview FY 2024-2025 - Power BI Export - PDF
Southern Mallee District Council Analytics Overview FY 2024-2025 - Power BI Embedded Report (Interactive Public)
~Prepared by Intern Deekshitha Goud Podeti
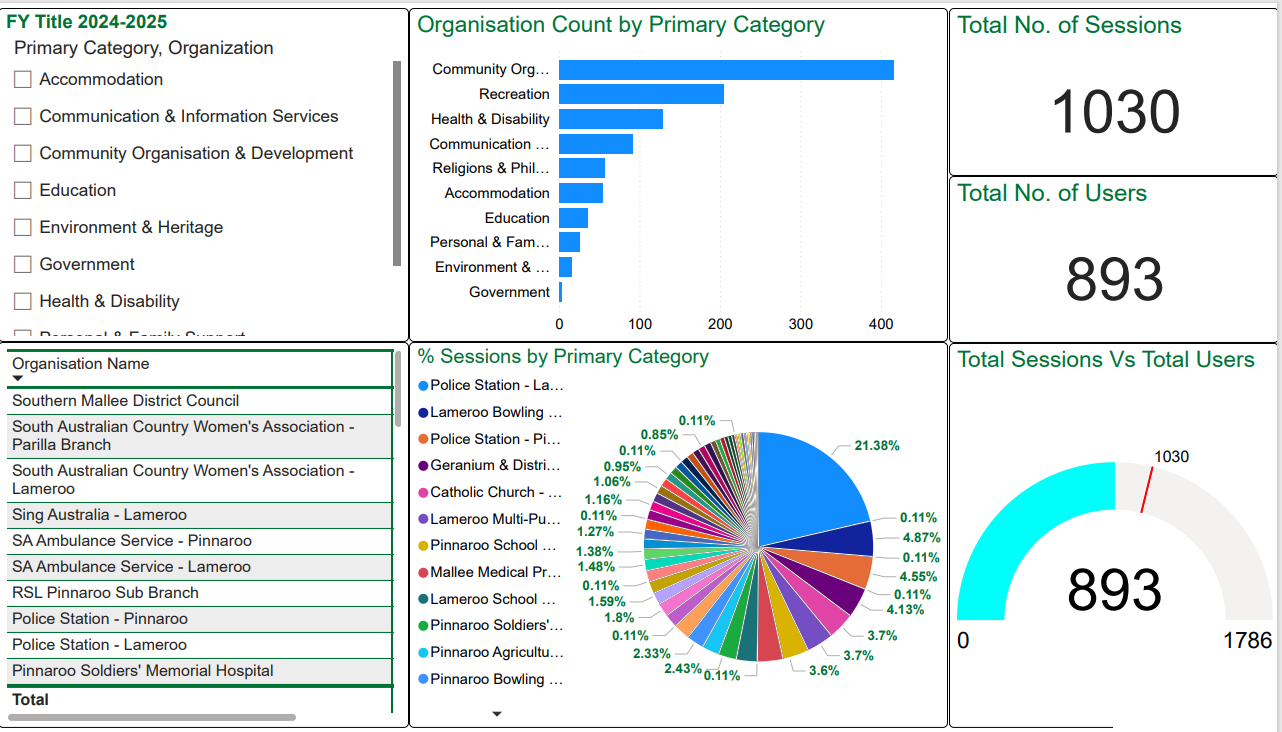
Southern Mallee District Council Data Analytics FY 2024-2025 - Dashboards
Southern Mallee Council Analytics Dashboard FY 2024-2025 - Power BI Embedded Report (Interactive Public)
Southern Mallee District Council Analytics Dashboard FY 2024-2025 - Power BI Export - PDF
~Prepared by Intern Deekshitha Goud Podeti
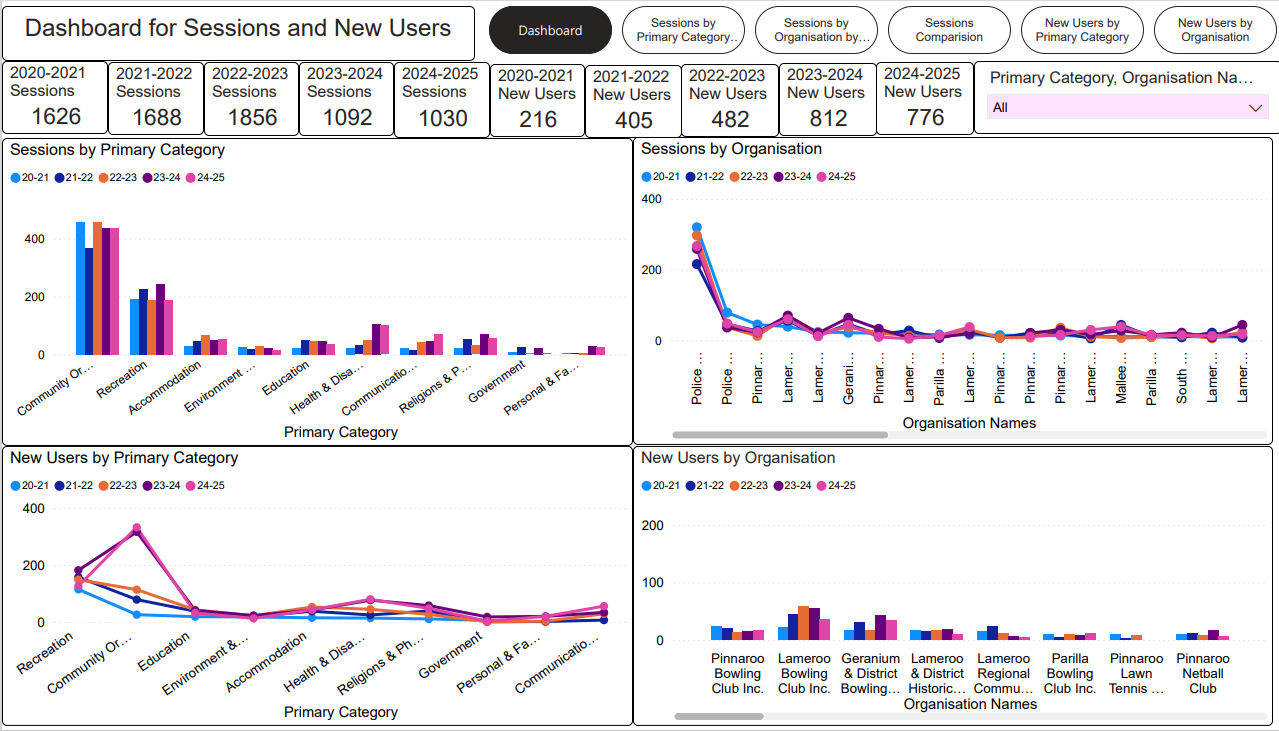
Southern Mallee District Council - Comparison of the Last 5 Financial Years
Southern Mallee District Council - Comparison of the last 5 Financial Years - Power BI Export-PDF
Southern Mallee District Council - Comparison of the last 5 Financial Years - Power BI Embedded Report(Interractive Public)
~Prepared by Intern Deekshitha Goud Podeti
5 Year Comparison Report - Insights
Community Organisation & Development emerged as the most consistently searched primary category across all five years. It also attracted the highest number of new users in the most recent financial years, reflecting strong community interest in local development initiatives.
Recreation, which was the leading category for new users in the earlier years (2020–2022), has seen a steady decline in engagement and new memberships over time.
The Lameroo Police Station has remained the most searched organisation every year, highlighting ongoing public interest in local law enforcement and related services.
New user registrations increased significantly year over year, rising from 216 in 2020–2021 to a peak of 812 in 2023–2024, before a slight drop to 776 in 2024–2025. This shows strong community adoption of the website, especially post-COVID.
Lameroo Bowling Club Inc. and Pinnaroo Bowling Club Inc. consistently ranked among the top organisations for both visits and new user sign-ups, indicating their continued popularity within the community.
Website session activity was at its highest in 2022–2023, coinciding with the peak in general user engagement. However, the past two years (2023–2025) show a decline in total sessions, possibly due to seasonal trends, shifting user interests, or saturation of the platform.
