Wattle Range Council
Wattle Range Council Data Analytics FY 2020-2021
Wattle Range Analytics Overview FY 2020-2021 - Canva - PDF
Wattle Range Analytics Overview FY 2020-2021 - Power BI Export - PDF
Wattle Range Analytics Overview FY 2020-2021 - Power BI (Interactive Public)
~Prepared by Intern Olivia Oanh Nguyen

Wattle Range Council Data Analytics FY 2021-2022
Wattle Range Analytics Overview FY 2021-2022 - Canva - PDF
Wattle Range Analytics Overview FY 2021-2022 - Power BI Export - PDF
Wattle Range Analytics Overview FY 2021-2022 - Power BI (Interactive Public)
~Prepared by Intern Olivia Oanh Nguyen
Wattle Range Council Data Analytics FY 2022-2023
Wattle Range Analytics Overview FY 2022-2023 - Canva - PDF
Wattle Range Analytics Overview FY 2022-2023 - Power BI Export - PDF
Wattle Range Analytics Overview FY 2022-2023 - Power BI (Interactive Public)
~Prepared by Intern Olivia Oanh Nguyen
Wattle Range Council Data Analytics Three Year Comparison FY 2020-2021, 2021-2022, 2022-2023
Wattle Range Analytics Three Year Comparison - Power BI Export - PDF
Wattle Range Analytics Three Year Comparison - Power BI (Interactive Public)
Wattle Range Analytics Three Year Comparison - Report Explanation & Data Insights - PDF
~Prepared by Intern Olivia Oanh Nguyen
Wattle Range Council Data Analytics Three Year Comparison includes four reports: Geographic Visualisation, Session Trends, New User Trends and Session Location and Time Analysis
Data Insights
Geographic Visualisation
Most sessions are located in three suburbs: Millicent, Penola, and Beachport. Millicent has the highest concentration with 60 out of 121 organisations (almost 50% of the organisations in the entire council). This suburb also has the most sessions, with 4620 out of 7472 sessions over three years (61.8%). However, although there was an increase in sessions from 2020-2021 to 2021-2022, we see a decreasing trend in 2022-2023 in Millicent, while Penola and Beachport continue to show a stable increase in sessions over three years. In terms of primary categories, Recreation, Community Organisation & Development, and Communication & Information Services account for the majority of sessions in the Millicent suburb, except Accommodation, which has the most sessions in the Penola suburb.
Despite a decrease in sessions from 2022-2023, Millicent remains the central hub with the highest number of organisations and sessions. To address the declining trend, it may be beneficial to investigate potential causes, such as changes in service quality or community needs. Since Penola and Beachport are experiencing stable growth in sessions, consider allocating more resources to these suburbs to support and sustain their upward trends. Promote Accommodation services more aggressively in Penola, given its leading position in this category, to further capitalize on its strengths.
Interestingly, Nangwarry Football Club is the only organisation in the Nangwarry suburb but has 183 sessions in total, more sessions than Southend, Kalangadoo, Coonawarra, Mount Burr, Tantanoola, and Kangaroo Inn, which have more than one organisation. Highlight and support unique organisations that show high engagement in small suburbs, such as Nangwarry Football Club. Use their success as a model to replicate in other suburbs with fewer organisations.
Three organisations have closed: Bedford Group Millicent, Driver Reviver SA – Millicent, and Tantanoola Primary School. Two of these organisations are in Millicent, and one is in Tantanoola.
Session Trends
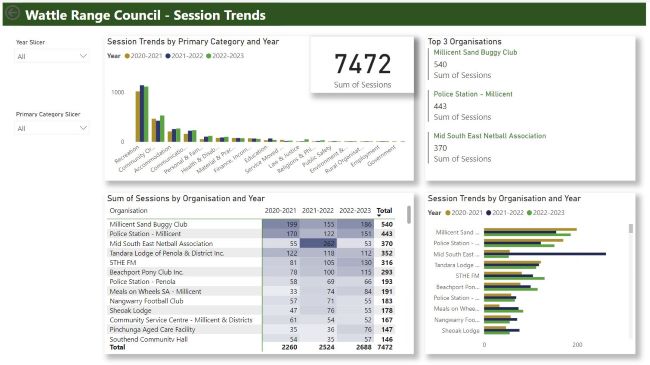
The total number of sessions increased from 2,260 in 2020-2021 to 2,688 in 2022-2023 across most primary categories, with the exception of recreation and education. This overall growth is encouraging, but a closer look reveals some organisations have experienced fluctuations or declines in their session numbers.
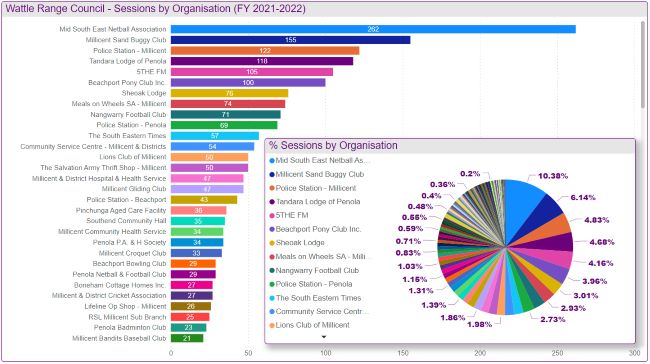
Six organisations recorded over 200 sessions from 2020-2021 to 2022-2023, indicating a strong and consistent demand for their services. These include Millicent Sand Buggy Club, Police Station - Millicent, Mid South East Netball Association, Tandara Lodge of Penola & District Inc., 5THE FM, and Beachport Pony Club Inc. However, some of these top organisations, like Millicent Sand Buggy Club, Police Station - Millicent, and Tandara Lodge of Penola & District Inc., have experienced a decrease in sessions over the past year. It is recommended to conduct detailed analyses to understand the reasons behind these declines and address any identified issues. These could include improving infrastructure, increasing community engagement, or providing additional support.
A special case is the Mid South East Netball Association, which saw a sharp increase in sessions from 2020-2021 to 2021-2022 but experienced a significant drop in 2022-2023. It is crucial to investigate the causes of these fluctuations and support to stabilise their session numbers. This may involve marketing efforts, program diversification, or community outreach initiatives.
On the other hand, organisations like 5THE FM, Beachport Pony Club Inc., Meals on Wheels SA - Millicent, Police Station - Beachport, and Millicent Community Health Service have shown a consistent increase in the number of sessions over the past three years. It is recommended to continue supporting these organizations with adequate resources and funding to sustain and further enhance their growth.
Furthermore, organisations such as Pinchunga Aged Care Facility, RSL Millicent Sub Branch, Coonawarra Petanque Club, RSL Coonawarra-Penola Sub Branch, and Justices of the Peace - Wattle Range Council have shown impressive growth in sessions. It would be beneficial to promote these organisations as effort stories and provide support to help them continue increasing their overall sessions.
For organisations that did not have any new sessions in 2023, such as Glencoe Netball Club, Coonawarra LPO, Penola Primary School, Vinnies - Millicent, and Women in Agriculture & Business - Kalangadoo, it is recommended to develop re-engagement strategies. This could include reaching out to understand their challenges, offering collaboration opportunities with other active organisations, and providing incentives for session reactivation. Additionally, organisations like Bedford Group Millicent, Tantanoola Primary School, and Driver Reviver SA - Millicent, which have closed, may require alternative solutions to address the needs of their former participants.
New User Trends
In general, there is a strong positive relationship between sum of new users and sum of sessions over three years. An increase in sessions across organisations is followed by an increase in new users.
In detail, there is an increase in the number of new users across most primary categories. A stable increase of new users is observed across all main primary categories: recreation, accommodation, and communication and information services. In community organisation and development category, there is a decrease in new users from 2020-2021 to 2021-2022, but an increase again in 2022-2023.
Among top organisations, we see an outstanding increase in the number of new users at Millicent Sand Buggy Club and Mid South East Netball Association, where the percentage of new users in total sessions accounts for 87.04% and 86.22%, respectively. We recommend conducting a detailed analysis of the strategies and initiatives implemented by these organizations to identify best practices that can be shared with other organizations to attract and retain new users effectively. It is also recommended to continuously monitor user engagement metrics, including new user acquisition and retention rates, and establish benchmarks and goals for new user growth, and regularly evaluate the effectiveness of strategies implemented to achieve these targets.
Session Location and Time Analysis
While most sessions originated from within Adelaide, a relative number were accessed from major Australian cities like Melbourne, Sydney, Brisbane, Perth, Darwin, and Canberra. Notably, another relative number of sessions came from Mount Gambier, which is in close proximity to the Wattle Range Council area. This suggests a keen interest from neighbouring communities in accessing the services offered by organisations within the Wattle Range region. To capitalise on this local interest, it is crucial to establish partnerships or cross-promotion opportunities with organisations in nearby areas like Mount Gambier. Such collaborations could attract more users and increase the overall reach of services.
Surprisingly, a number of sessions were accessed from outside Australia, primarily from the United States, India, and New Zealand. Particularly noteworthy is the increase in sessions from the United States and New Zealand between 2022 and 2023. It is recommended to investigate the reasons behind this growing international interest, as it could present opportunities for expanding reach and collaborating with organisations or communities in these regions.
Regarding peak access times, in 2022, the highest engagement was observed during March, April, and May, with over 150 sessions recorded during these months. Towards the end of the year, session numbers remained stable at around 125. However, in 2023, there was a noticeable shift in interest, with a significant increase in sessions from August to December, peaking at 300 sessions in November. In contrast, the beginning of the year saw a consistent level of around 125 sessions. It is advisable to analyse the factors contributing to higher engagement during specific periods (e.g., March-May in 2022 and August-December in 2023). Understanding these patterns can guide the timing of marketing campaigns, event planning, or service offerings to align with periods of increased interest, maximising engagement and reach.
Sign up for the newsletter!
Subscribe to our monthly newsletter to receive news, information and events for the community sector in SA.


