Mount Gambier Council

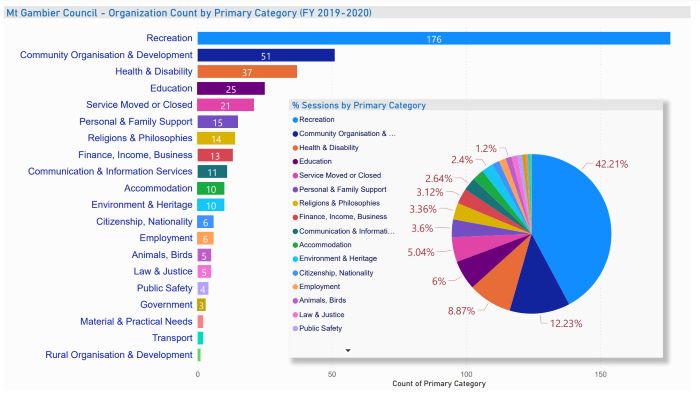
Mount Gambier Council Data Analytics FY 2019-2020
Mount Gambier Analytics Overview FY 2019-2020 - Canva - PDF
Mount Gambier Analytics Overview FY 2019-2020 - Power BI Export - PDF
Mount Gambier Analytics Overview FY 2019-2020 - Power BI Embedded Report (Interactive Public)
~ Prepared by Volunteer Stathis Avramis
Mount Gambier Council Data Analytics FY 2020-2021
Mount Gambier Analytics Overview FY 2020-2021 - Canva - PDF
Mount Gambier Analytics Overview FY 2020-2021 - Power BI Export - PDF
Mount Gambier Analytics Overview FY 2020-2021 - Power BI Embedded Report (Interactive Public)
~ Prepared by Volunteer Renu Bala
.png)
Mount Gambier Council Data Analytics FY 2021-2022
Mount Gambier Analytics Overview FY 2020-2021 - Canva - PDF
Mount Gambier Analytics Overview FY 2020-2021 - Power BI Export - PDF
Mount Gambier Analytics Overview FY 2020-2021 - Power BI Embedded Report (Interactive Public)
~ Prepared by Volunteer Shoaib Khalid
Mount Gambier Council Data Analytics FY 2022-2023
Mount Gambier Analytics Overview FY 2022-2023 - Canva - PDF
Mount Gambier Analytics Overview FY 2022-2023 - Power BI Export - PDF
Mount Gambier Analytics Overview FY 2022-2023 - Power BI Embedded Report (Interactive Public)
~ Prepared by Volunteer Shoaib Khalid
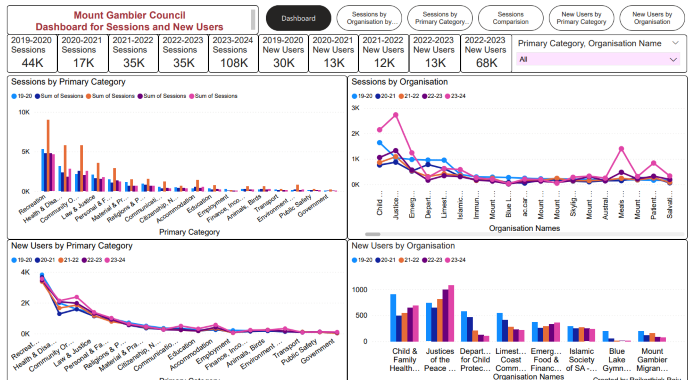
Mount Gambier 5 Year Comparison Report
~ Prepared by Volunteer Shoaib Khalid
Data Insights
This dashboard providesd a comprehensive overview of the Mount Gambier Council's performance in terms of sessions and new users across different primary categories and oraganizations It highlights trends and patterns in user engagement over the period from 2019-20 to 2022-2023, with data segregated by year. The data shows a significant decline in overall sessions across all categories. While the "Health & Disability" category maintains a consistent high number of sessions, there are noticeable decrease in areas like "Law & Justice" and "Community Organizations". The "New Users" section reveals a similar trend, with a noticeable decrease in the number of new users across most categories. This data could be used by the Mount Gambier Council to identify areas of focus for future improvements and strategies for user engagement.
Session Overview
- Significant Growth: Sessions have shown remarkable growth, increasing from 44K in 2019-2020 to 108K in 2023-2024, indicating a substantial rise in engagement with council services.
- Yearly Trends: There was a dip in sessions in 2020-2021 (17K), likely due to COVID-19 restrictions, but numbers recovered and stabilized around 35K in 2021-2022 and 2022-2023 before the major jump in 2023-2024.
New Users Overview
- Initial High, The Decline: New user numbers were highest in 2019-2020 at 30k,but have since declined and stabilized around 12-13K in recent years.
- Recent Surge: There's a significant increase in new users for 2023-2024, jumping to 68K, which aligns with the session increase.
Primary Category Insights:
- Top Categories: Recreation, Health & Disability, Community Oraganisation & Development, and law & Justice consistently show the highest engagement across both sessions and new users.
- Underperforming Areas: Categories like Accomodation, Employment, and Finance show consistently lower engagement and might need targeted strategies for improvement.
Oragnization-Specific Insights
- Leading Organisations: Child & Family Health Services, Justice of the Peace, and Emergency Food & Financial Assistance consistently show high engagement.
- Fluctuating Engagement: Some organization like the Department for Child Protection and Limestone Coast Community Justice Centre show variable engagement over the years.
- Growth Opportunities: Several organizations show declining engagement over time, presenting opportunities for renewed outreach or service improvements.
Year-over-Year Comparisons
- 2019-2020 Baseline: This year shows high engagement across most categories and organizations, setting a strong baseline.
- 2020-2021 Dip: There's a noticeable decrease in both sessions and new users, likely due to pandamic-related factors.
- 2021-2023 Recovery: These years show steady recovery and stabilization in most metrics.
- 2023-2024 Surge: This year shows exceptional growth in both sessions and new users across many categories and organizations.
Key Observations
- Resilience: Despite fluctuations, the council's services have shown resilience, particularly in core areas like health, community services, and recreation.
- Digital Adoption: The significant increase in sessions and new users in 2023-2024 might indicate successful digital transformation efforts or new online services.
- Changing Needs: Shifts in category popularity over time may reflect changing community needs or priorities.
Sign up for the newsletter!
Subscribe to our monthly newsletter to receive news, information and events for the community sector in SA.


.png)
.jpg)

