![]()
![]()
![]()
Onkaparinga Council (City of Onkaparinga)

Onkaparinga Council Data Analytics FY 2020-2021
Onkaparinga Council Analytics Overview FY 2020-2021 - Canva - PDF
Onkaparinga Council Analytics Overview FY 2020-2021 - Power BI Export - PDF
Onkaparinga Council Analytics Overview FY 2020-2021 - Power BI Embedded Report (Interactive Public)
~Prepared by Intern and Volunteer Putri Khalilah binti Kamaluddin

Onkaparinga Council Data Analytics FY 2021-2022
Onkaparinga Council Analytics Overview FY 2021-2022 - Canva - PDF
Onkaparinga Council Analytics Overview FY 2021-2022 - Power BI Export - PDF
Onkaparinga Council Analytics Overview FY 2021-2022 - Power BI Embedded Report (Interactive Public)
~Prepared by Intern and Volunteer Putri Khalilah binti Kamaluddin
.png)
Onkaparinga Council Data Analytics FY 2022-2023
Onkaparinga Council Analytics Overview FY 2022-2023 - Canva - PDF
Onkaparinga Council Analytics Overview FY 2022-2023 - Power BI Export - PDF
Onkaparinga Council Analytics Overview FY 2022-2023 - Power BI Embedded Report (Interactive Public)
~Prepared by Intern Charmi Ketan Divecha
.png)
Onkaparinga Council Data Analytics FY 2023-2024
Onkaparinga Council Analytics Overview FY 2023-2024 - Canva - PDF
Onkaparinga Council Analytics Overview FY 2023-2024 - Power BI Export - PDF
Onkaparinga Council Analytics Overview FY 2023-2024 - Power BI Embedded Report (Interactive Public)
Onkaparinga Council Analytics Dashboard FY 2023-2024 - Power BI Export - PDF
Onkaparinga Council Analytics Dashboard FY 2023-2024 - Power BI Embedded Report (Interactive Public)
~Prepared by Intern Charmi Ketan Divecha
.png)
Onkaparinga Council Data Analytics FY 2024-2025
Onkaparinga Council Analytics Overview FY 2024-2025 - Canva - PDF
Onkaparinga Council Analytics Overview FY 2024-2025 - Power BI Export - PDF
Onkaparinga Council Analytics Overview FY 2024-2025 - Power BI Embedded Report (Interactive Public)
Onkaparinga Council Analytics Dashboard FY 2024-2025 - Power BI Export - PDF
Onkaparinga Council Analytics Dashboard FY 2024-2025 - Power BI Embedded Report (Interactive Public)
~Prepared by Intern Charmi Ketan Divecha
Onkaparinga Council Data Analytics FY 2024-2025
Onkaparinga Council 5 Year Comparison - Power BI Export - PDF
Onkaparinga Council 5 Year Comparison - Power BI Embedded Report (Interactive Public)
Onkaparinga Council 5 Year Comparison - Data Insights - PDF
~Prepared by Intern Charmi Ketan Divecha
Data Insights
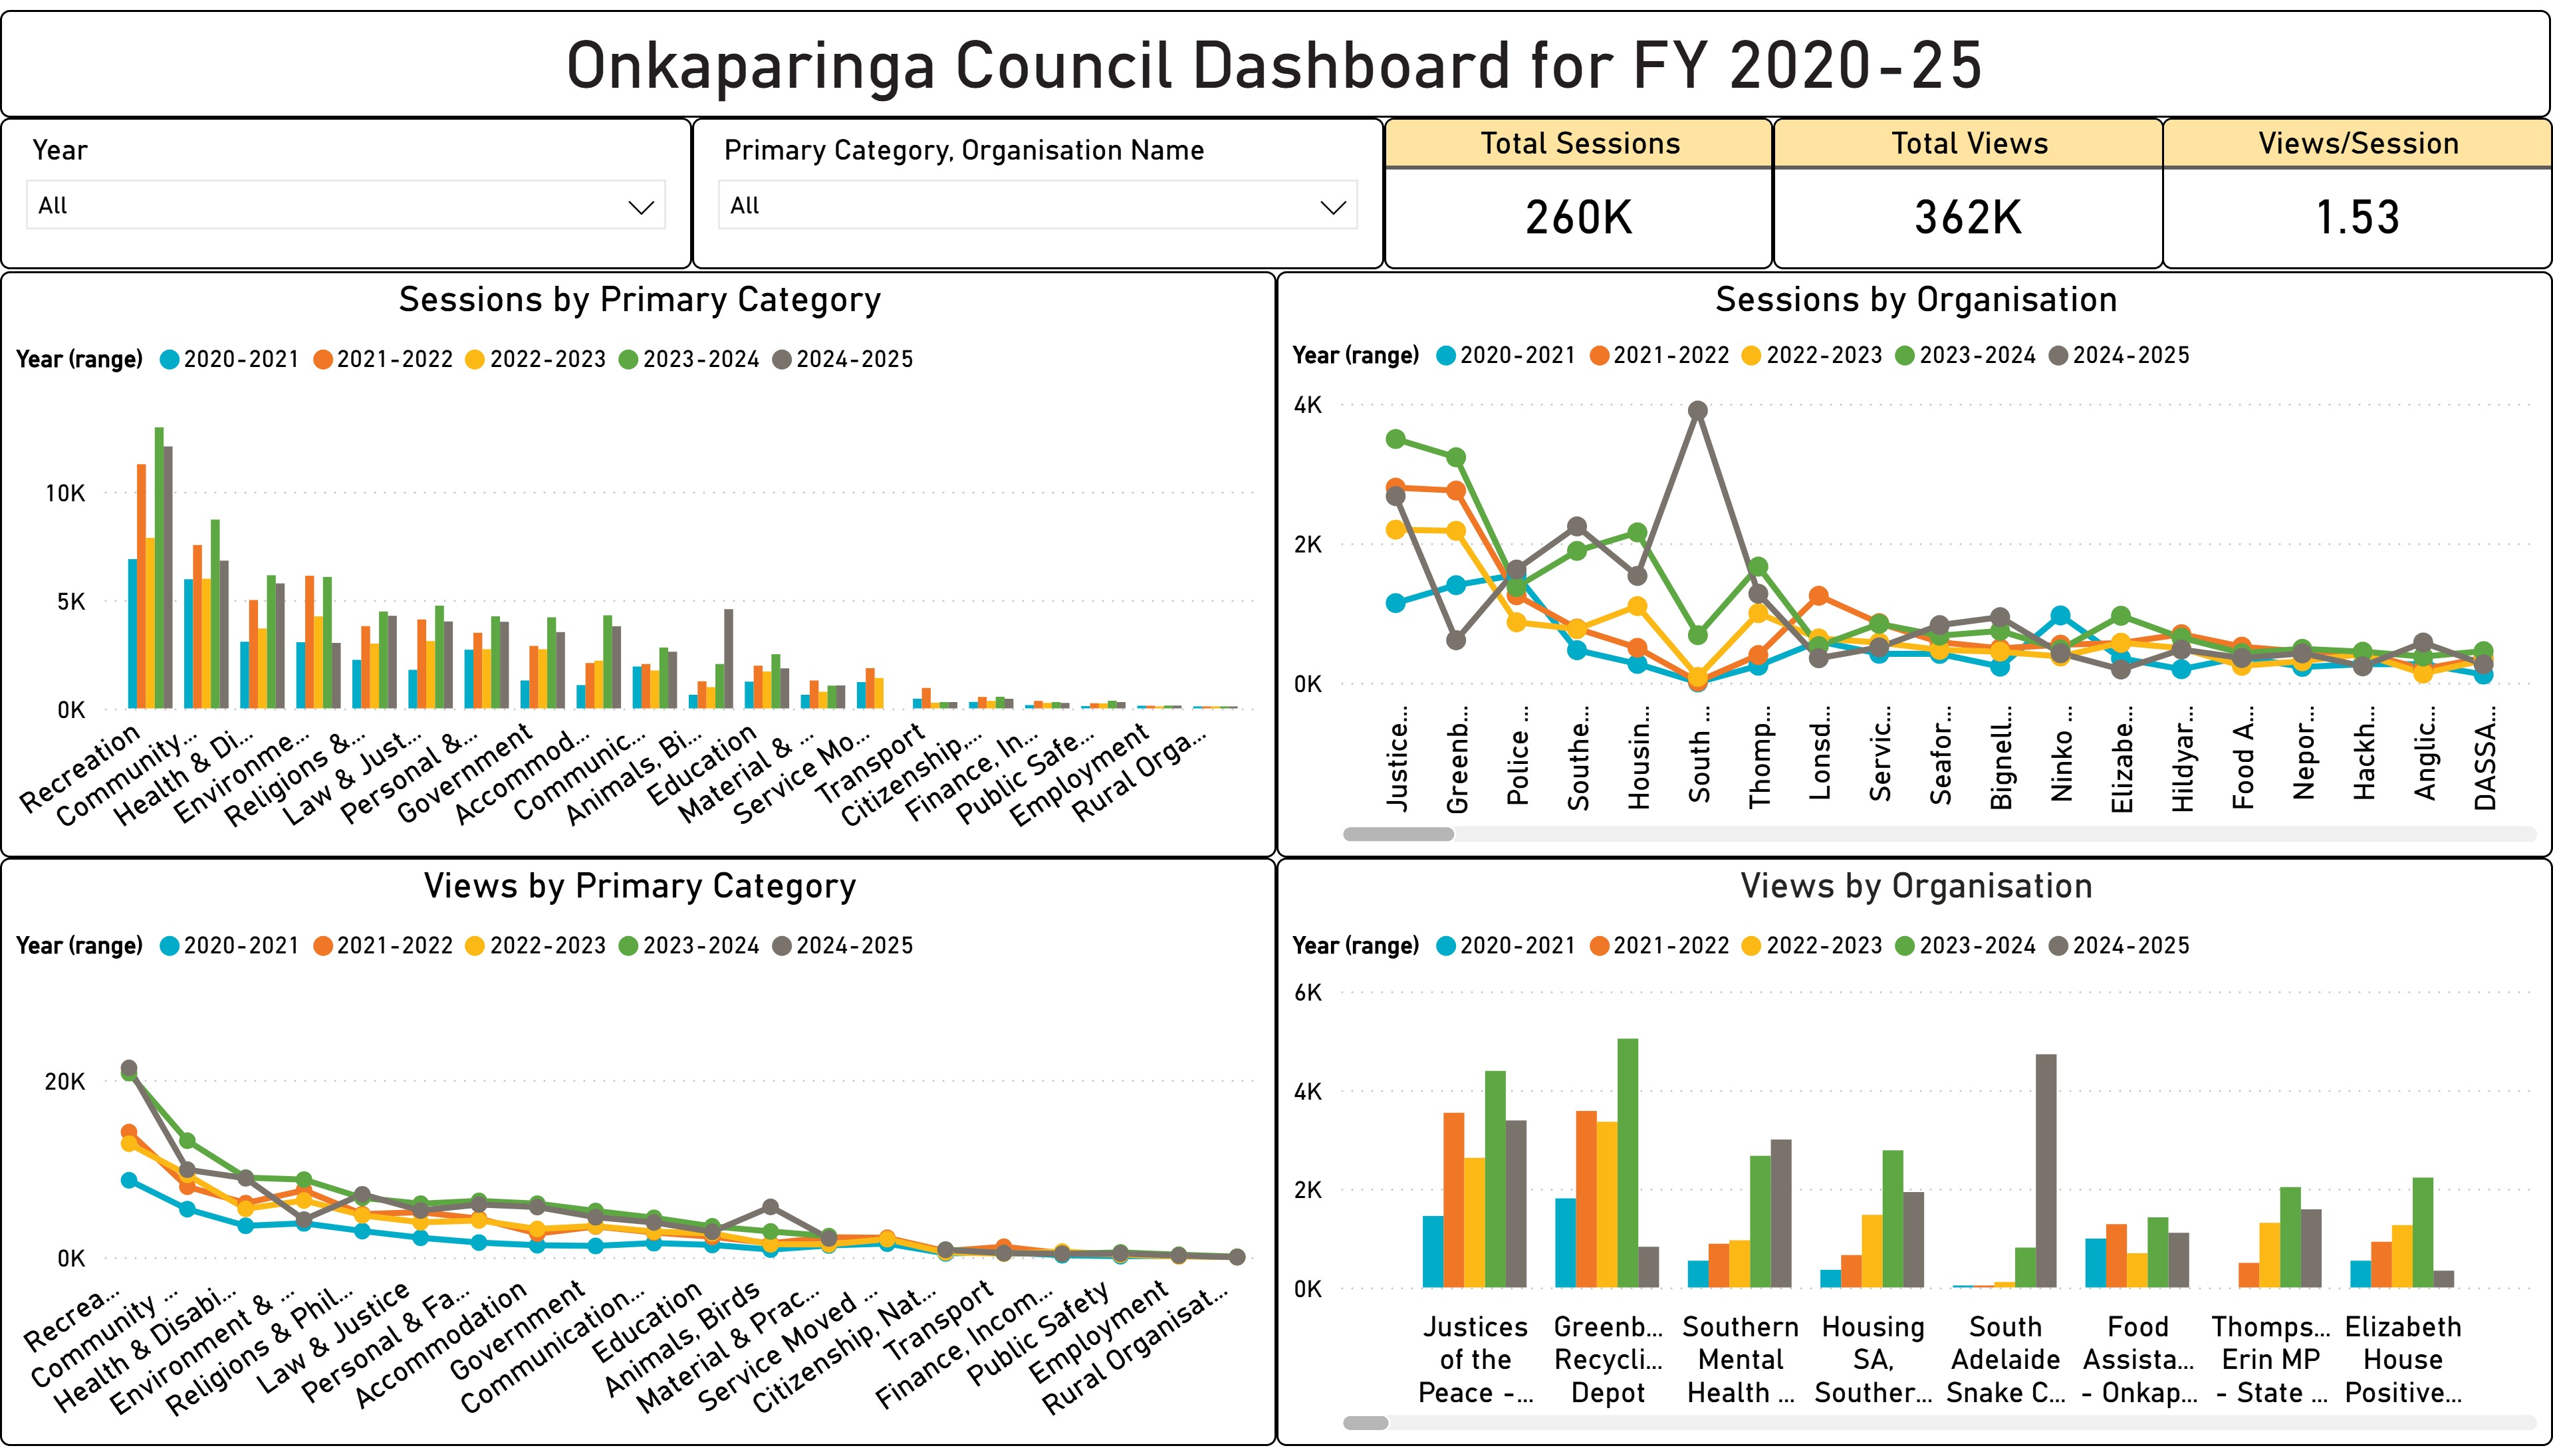
Dashboard (Overall Summary) ~ by Intern Charmi Ketan Divecha
The five-year dashboard offers a high-level overview of engagement trends across Onkaparinga Council’s services between FY 2020–21 and FY 2024–25. During this period, the council recorded 260,000 sessions, supported by 362,000 views, with users averaging 1.53 views per session, indicating that most community members engaged with more than one service area during a visit. The data shows a steady growth trajectory from FY 2020–21 onwards, culminating in a peak year in FY 2023–24, when engagement reached 66,000 sessions. Although there was a decline to 59,000 sessions in FY 2024–25, activity remained higher than in the early years of the period, signalling a healthy overall growth trend. At a service category level, recreation, community organisation & development, and health & disability consistently ranked as the most accessed services. Meanwhile, areas such as law & justice, environment & heritage, and personal & family support maintained a steady but comparatively lower engagement base, while employment, finance, and public safety were niche areas, serving smaller groups within the community. The dashboard underlines the council’s capacity to balance demand for essential civic services with broader recreational and wellbeing programs.
User Insights ~ by Intern Charmi Ketan Divecha
Over five years, the council engaged 238,000 unique users, of which 188,000 were new, representing nearly 80% of the total. This demonstrates a strong ability to attract fresh participants while also retaining a significant returning user base. The trend line for user growth parallels the overall session data, with the peak occurring in FY 2023–24 before a modest decline in FY 2024–25. Category-level insights confirm that recreation, community development, and health services had the widest user reach, suggesting these areas are critical anchors for council-led engagement. In contrast, categories such as employment, finance, and citizenship-related services showed narrower user bases, indicating they are either specialised or less frequently required. Organisationally, Justices of the Peace, Greenbanks Recycling Depot, Southern Mental Health Services, Housing SA, and local police stations consistently ranked among the highest in user counts, reflecting their importance in providing reliable, everyday support to the community. The high inflow of new users year after year suggests that the council has been effective in expanding its reach, building awareness, and connecting with previously untapped segments of the population.
Views Analysis ~ by Intern Charmi Ketan Divecha
The views analysis highlights the depth of interaction across council services. With 362,000 total views across 260,000 sessions, users demonstrated a tendency to browse and engage beyond a single activity, resulting in an average of 1.53 views per session. Categories such as recreation, community organisation & development, and health & disability consistently recorded the largest share of views, reinforcing their role as the most attractive areas of service. Notably, environment & heritage services performed strongly in the earlier years of the period but slipped in FY 2024–25, indicating either a change in programming or shifting community priorities. At the organisational level, high engagement was concentrated among long-standing civic providers, including Justices of the Peace, Greenbanks Recycling Depot, Southern Mental Health Services, and Housing SA. By FY 2024–25, South Adelaide Snake Catchers had emerged as a major source of viewing activity, suggesting an increased focus on wildlife-related community needs. The analysis also identified consistently high “views per session” ratios for some organisations, such as legal and government-related services, suggesting that when residents engage with these providers, they tend to seek out multiple pieces of information during a single session.
Organisation Explorer ~ by Intern Charmi Ketan Divecha
The organisation explorer page reveals the breadth and diversity of the council’s service ecosystem. Over the five-year period, participation was spread across hundreds of organisations, ranging from large civic institutions and state service providers to smaller grassroots community groups. Long-standing providers such as Justices of the Peace, Housing SA, local police stations, and Service SA formed the backbone of essential service delivery, consistently drawing steady session counts. At the same time, the explorer highlights the increasing contribution of faith-based groups, cultural associations, and recreation facilities, such as sports clubs and leisure centres, which collectively supported both social cohesion and lifestyle activities. Smaller organisations including repair cafés, environmental volunteer groups, and local arts studios showed gradual increases in engagement across the period, reflecting the community’s growing interest in sustainability, creativity, and social connectedness. The data underscores how the council balances demand for core administrative and civic services with programs that foster wellbeing, culture, and grassroots participation.
Geographical Insights ~ by Intern Charmi Ketan Divecha
Geographic insights highlight the spatial distribution of engagement across the City of Onkaparinga and beyond. The bulk of sessions originated from Adelaide and southern metropolitan suburbs such as Christies Beach, Happy Valley, Aldinga, Flagstaff Hill, and Hackham, reinforcing the council’s strong local footprint. Engagement extended into regional South Australia, including Mount Gambier and Copper Coast, demonstrating some reach beyond the council’s immediate boundaries. At a national level, modest engagement was also recorded in Melbourne, Sydney, Brisbane, Darwin, and Perth, reflecting connections with individuals outside the state who still access or interact with council services, possibly due to mobility, relocation, or remote digital access. International activity, while small in scale, was recorded in countries such as the United States, New Zealand, India, China, and the United Kingdom, hinting at a global layer of interaction linked to migration, family ties, or international interest in local programs. This spatial analysis reinforces that while Onkaparinga’s services remain primarily community-based, they also resonate at broader geographic levels, extending the council’s digital and service footprint.
Geo-Tagging for Services ~ by Intern Charmi Ketan Divecha
The geo-tagging analysis provides detailed insights into how services are distributed across the council’s suburbs. Service access points were spread across areas such as Aberfoyle Park, Christies Beach, Happy Valley, Aldinga, Clarendon, Flagstaff Hill, and Hackham, ensuring that both coastal and inland communities were included in the service network. Categories covered under geo-tagging include accommodation, health and disability, recreation, community development, education, and personal support, illustrating a comprehensive mix of essential and lifestyle services. The mapping demonstrates that geo-tagging is being effectively used to identify areas of high concentration, highlight overlaps, and reveal potential service gaps. This allows the council to plan strategically by reallocating resources to underserved suburbs, supporting equity in access. Importantly, geo-tagging makes visible the council’s wide geographic service footprint, confirming that residents across diverse localities benefit from a broad range of programs, while also creating opportunities to enhance targeted delivery in growing or underrepresented areas.
