![]()
![]()
![]()
Adelaide University Internship - Charmi Divecha

Welcome Charmi!
Charmi Divecha has joined our Data Analytics Team for her Adelaide University SET (Sciences, Engineering and Technology) Internship for Data Science for Trimester 2, 2025, 27 May 2025 - 22 August 2025.
She is completing a 280 hour internship onsite with SAcommunity at the Connecting Up Office, Infoxchange 22.5 hours a week for 12 weeks over 3 days around her university classes.
Total Hours 280 Joined 27 May 2025 Last Check-in 20 August 2025 (Completed)
Personal Biography
Charmi is currently pursuing a Master of Data Science, having previously completed a Bachelor’s degree in the same field. Her academic journey has been marked by a strong foundation in data-driven methodologies, supported by university projects and a hands-on internship. These experiences have allowed her to deepen her expertise in key areas such as Machine Learning, Data Analysis, and Artificial Intelligence. She has also gained proficiency in industry-relevant tools and programming languages, including Python, R, SQL, and Tableau. She is the first author of a research paper on AI-based news summarization and classification, published in Springer as part of the 23rd International Conference on Hybrid Intelligent Systems (HIS 2023).
At Connecting Up, she is eager to further refine her analytical skills, particularly through practical applications of Power BI. She is also enthusiastic about developing new competencies in Google Analytics, recognising its growing importance in data-driven decision-making. Through this internship, she aims to broaden her exposure to real-world datasets and challenges, which will not only enhance her technical capabilities but also allow her to grow her professional network within the industry.
Looking ahead, she is keen to build a career as a Data Analyst, Data Scientist, or Financial Analyst, particularly within the finance sector. Her long-term goal is to leverage her technical knowledge and data science skills to extract meaningful insights from financial data, thereby contributing to data-informed strategic decisions. She is passionate about bridging the gap between data and business outcomes and sees the finance industry as an ideal environment to achieve this.
Community Services in Councils Project
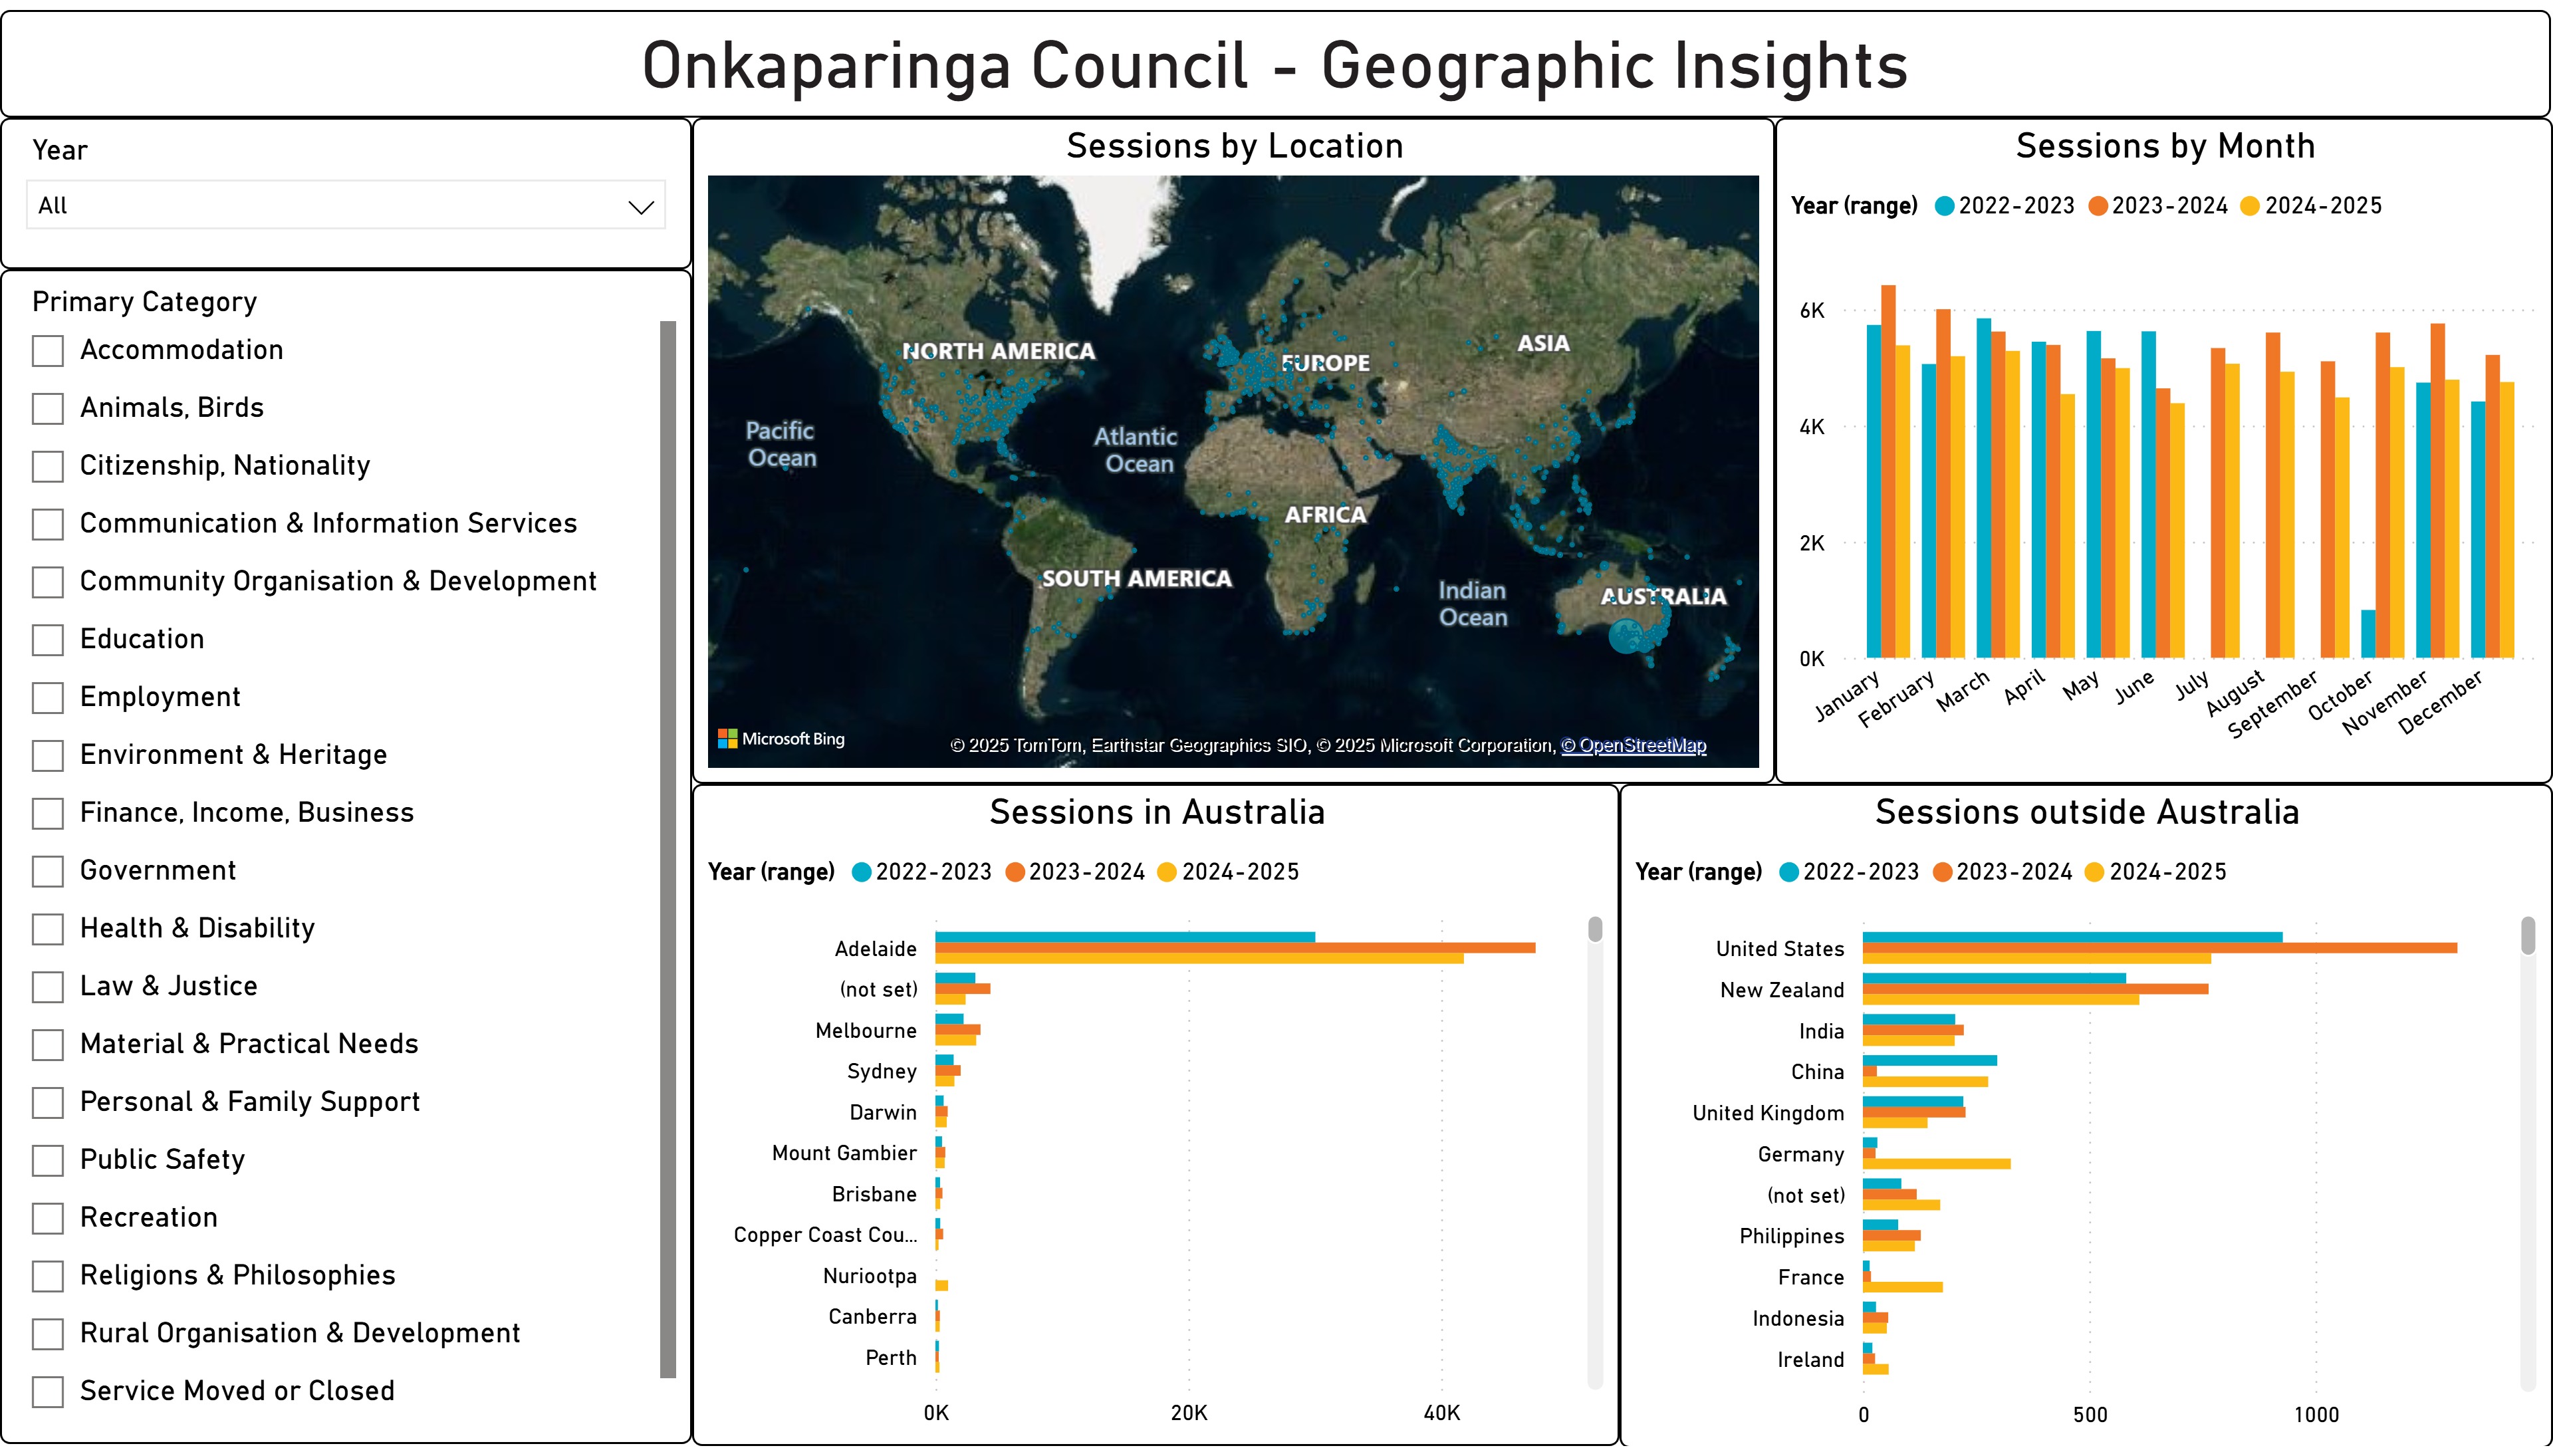
I selected the largest dataset in SAcommunity Onkaparinga Council (City of Onkaparinga) for my Power BI council report, the dataset is approximately 1165 community services operating in the area for the financial years 2022-2023, 2023-2024 and 2024-2025. My reports followed previous visualisation report work by Putri Kamaluddin, and utilised given templates, my completed report can be found>>here.
There are a number of steps involved in the creation of community service information data presentations. A summary of data trends prepared, using information from Google Analytics and SAcommunity with subsequent Power BI and Canva reports revealing data anomalies and corrections required, the database is updated and reports re-created with improved information. Final data reports are published to the website, and were introduced by me to Onkaparinga council stakeholders for information and/or feedback on 30 July 2025.
Insights from Power BI Report
The five-year analysis of Onkaparinga Council’s service engagement (FY 2020–25) highlights a total of 260,000 sessions, 362,000 views, and 238,000 users, with engagement peaking in FY 2023–24 before easing slightly in FY 2024–25. Across the period, recreation, community organisation & development, and health & disability consistently dominated participation, while categories such as animals & birds and religions & philosophies gained prominence more recently, reflecting evolving community interests. Long-standing service providers like Justices of the Peace, Greenbanks Recycling Depot, Housing SA, and Southern Mental Health Services remained vital, though smaller organisations and local initiatives steadily grew their presence. Geographical analysis confirmed strong engagement in Adelaide’s southern suburbs, moderate interstate use, and modest international participation, while geo-tagging showed wide service accessibility across local communities. More details can be found>>here, utilising the [GA4] Analytics Insights tool.
Skill Development
The project allowed strengthening data management and analytical practices through the development of a 5-year comparison project spanning the financial years 2020–21 to 2024–25. This work involved building practical skills in cleaning and standardising datasets, identifying and resolving inconsistencies across multiple years, and preparing data for analysis.
I also gained experience in transforming raw information into structured insights by integrating given Python codes for data preparation and Power BI for data visualisation from capacity building work undertaken by former volunteers and interns, and current volunteer Anubhav Datagupta along with codes prepared and demonstrated by fellow intern Joy Meixuan Liao that were utilised for my council as seen below. Through this process, I enhanced my capability to manage large-scale datasets while utilising provided dashboard templates that effectively communicate patterns, trends, and insights to stakeholders.
.png)
Cleaning the data
A crucial first step in the process was data cleaning, ensuring consistency across the five yearly datasets. For this, the “Check Old vs New” notebook, which acted as a validation tool before deeper consolidation.
This notebook compared organisation records between consecutive years (2020–21 through 2024–25) to identify mismatches. Using pandas, the script standardised column names, checked organisation names, and compared categories. If mismatches were found, such as spelling differences or a category change for the same organisation — they were flagged and exported into Excel reports (e.g., org_name_23.xlsx, pri_cat_22.xlsx).
By automating these checks, the notebook ensured that issues were caught early, reducing the risk of errors carrying forward. This validation layer made the subsequent analysis more reliable and saved significant manual effort.
.png)
Preparing the Consolidated Dataset
Once the data was checked for inconsistencies, the “5 Year Comparison” notebook was created to consolidate all datasets into one master file. This step was central to creating a dataset ready for analysis and visualisation.
Key tasks in this stage included:
- Importing Yearly Files: Each financial year’s dataset was loaded separately using pandas.
- Merging Data: A custom function, merge_cleaned_data(), aligned column names, handled missing values, and removed duplicates before combining all years.
- Standardisation: Organisation names and categories were cleaned and matched across years to ensure uniformity.
- Metric Calculation: Core measures, such as total users and total views per year, were calculated as the foundation for Power BI visuals.
Alongside this, supporting notebooks such as “Get-Location” (for geo-tagging organisations with latitude and longitude) and “Subject-ID” (for resolving inconsistent identifiers) developed by peer intern Joy Meixuan Liao were also utilised. These scripts provided structured parameters that Power BI could use directly.
By the end of this stage, the data was cleaned, consolidated, and reliable dataset spanning five financial years which was the backbone of the PowerBI report.
Designing PowerBI Comparison Report
With the prepared dataset, the focus shifted to visualisation and storytelling in Power BI. The cleaned data was imported and created measures using both the provided Python-generated parameters and DAX formulas inside Power BI.
The report design focused on clarity and insight:
- Year-on-Year Comparisons: Visuals highlighted changes in users and views across five years.
- Engagement Metrics: Measures such as views per session revealed behavioural patterns.
- Geographical Insights: Interactive maps showed the regional distribution of organisations.
- Category Trends: Line and bar charts tracked shifts in organisational categories over time.
The dashboard was styled with the council’s theme, ensuring a professional and consistent look. By combining provided Python codes for data preparation and provided Power BI templates for storytelling, I produced a report that was accurate, insightful, and visually engaging with input from my supervisor. The codes replicated from those given supporting all the stages can be found>>here
Enhancing the Playgroup Listings in the City of Onkaparinga
As part of my internship with the City of Onkaparinga, I undertook a data validation and enhancement project focused on improving the quality and reliability of playgroup listings on the SAcommunity platform. The initiative was prompted by insights drawn from Power BI reports, which revealed unusually high engagement with the listing titled All About Playgroups in the City of Onkaparinga. Upon closer examination, and in discussion with my supervisors and coordinator it became evident that this listing served as an aggregate reference rather than representing a single organisation, prompting a thorough investigation.
As was suggested to me by my supervisor, I began by comparing the playgroups listed under this entry with an authoritative official register maintained by Playgroup SA. This comparison revealed notable inconsistencies—many playgroups listed on SAcommunity were not reflected on Playgroup SA’s website, and vice versa. To address this, I verified the details of each organisation through their official websites and, when required, contacted them directly via email or phone to confirm the current status of their playgroup services. I then removed outdated listings, updated organisational names where changes had occurred, and added missing entries to ensure comprehensive coverage.
As a result, several new organisation profile records were created, and all relevant details were reviewed and updated to ensure clarity and consistency across the platform. The outcome of this work is a more accurate and accessible resource for families and caregivers in the Onkaparinga region. By improving the integrity of this data, I helped strengthen community engagement and ensured that reliable, up-to-date information is readily available for those seeking early childhood programs in the area.
.jpg)
Telephone Techniques 9 July 2025
As part of the internship, I took part in a telephone training session led by Christ, where I practiced different approaches to handling calls in a professional manner. The exercises focused on tone, choice of words, and active listening to better understand the needs of stakeholders. Through these activities, I was able to develop greater confidence in managing conversations and gained a clearer sense of how to communicate effectively with organizations and council representatives.
.jpg)
Calling the Council 30 July 2025
I contacted the local council to confirm details and provide updates relevant to their directory. Alongside this, she reached out to five different organizations to verify their current information and ensure records were accurate. These activities not only strengthened my communication skills but also contributed to keeping community data reliable and up to date.
.jpg)
Charmi Divecha with Tomer Ginel, Chief Financial Officer (CFO), Infoxchange
Mentor Meeting 23 July 2025
Meeting Tomer Ginel was an eye-opening experience that gave me both practical knowledge and strategic perspective on how finance is evolving with the rise of data science. He explained how tools like predictive modelling, automation, and real-time reporting are changing the role of finance teams, shifting them away from traditional backward-looking functions toward forward-looking, insight-driven decision-making. A recurring theme was the importance of building strong data foundations before applying advanced tools, as poor-quality data can undermine even the most sophisticated models. Tomer also shared career guidance, encouraging me to pair my technical expertise with a strong understanding of business fundamentals, communication, and strategy. Overall, the conversation provided me with a clear roadmap for how to position myself for meaningful roles in finance while leveraging my background in data science.
- How do professionals typically apply tools like data analysis and predictive modelling in areas such as risk assessment, budgeting, or forecasting? In your experience as a CFO, which areas of financial decision-making do you find benefit the most from data science?
Tomer explained that data science is increasingly used in financial decision-making to bring forward-looking insights that traditional financial statements cannot capture. For example, in risk assessment, predictive modelling can help anticipate potential financial risks by combining historical data with external market indicators, giving CFOs a clearer picture of vulnerabilities before they materialise. In budgeting and forecasting, data science enables scenario planning—testing “what if” models around revenue fluctuations, cost changes, or external shocks. He noted that, in his role as a CFO, the greatest benefit comes from tools that allow real-time insights into cash flow, resource allocation, and financial health. Instead of waiting for quarterly results, data-driven forecasting can guide timely decisions that keep the organisation agile. - Many finance teams today are investing in automation and predictive analytics. From your experience, how is the finance sector adapting to these technologies, and where do you see the most impactful use cases?
He shared that the finance sector is steadily embracing these tools, though adoption varies across organisations. Automation has been especially impactful in reducing repetitive manual tasks such as reconciliations, reporting, and compliance checks. This allows finance professionals to focus more on interpreting results rather than just processing numbers. Predictive analytics is being used to refine forecasts, monitor budgets dynamically, and flag anomalies early. Tomer highlighted that the most impactful use cases are those tied to decision-making speed—where leadership can respond quickly to changing conditions because they have predictive insights at hand. At the same time, he cautioned that while these technologies bring great value, successful adoption depends on organisational culture, data maturity, and the willingness of teams to embrace change. - Are there specific key business concepts or financial principles you feel I should master alongside my technical skills to become more effective in this space?
Tomer stressed that while technical skills in data science are highly valuable, they must be complemented by a solid understanding of core financial and business principles. He advised focusing on fundamentals such as cash flow management, cost structures, and the budgeting process, as these form the backbone of most strategic financial decisions. Beyond financial concepts, he also pointed out the importance of strategic thinking—understanding how different departments contribute to the organisation’s goals, how external market forces shape decisions, and how to communicate complex financial insights clearly to stakeholders. In his view, the strongest professionals are those who can merge technical analysis with business acumen, making data-driven recommendations that align with broader organisational strategy. - As someone with a data science background, how would you suggest that I best position myself for a strategic role in the finance sector?
He encouraged me to position myself as someone who can bridge the gap between data and strategy. Rather than focusing only on technical outputs, I should show how my skills can generate insights that directly influence financial and organisational decisions. This means developing the ability to tell stories with data, translate complex models into simple, actionable insights, and demonstrate an understanding of business priorities. Tomer advised that building commercial awareness is just as critical as technical expertise—knowing how markets, customers, and industries operate enables a data scientist to contribute at a strategic level. He also suggested that showcasing collaborative skills, particularly working with executives and non-technical stakeholders, can help me stand out as someone who adds value beyond analysis. - I am currently pursuing a Master of Data Science, and as part of my final year, I have the opportunity to undertake an industry-based project for the course Data Science Research Project A & B. Are there any finance-related projects or challenges at Infoxchange where I could potentially contribute—particularly those that would give me exposure to real-world financial strategy and decision-making?
Tomer suggested that there could be meaningful opportunities at Infoxchange that align with my interest in combining finance and data science. He mentioned possibilities such as improving financial forecasting models to better predict funding cycles, enhancing reporting dashboards for clearer visibility of financial performance, or working on projects related to data quality and integration—critical challenges in finance. These kinds of projects would not only give me technical exposure but also allow me to understand how financial strategy is applied in real-world settings, particularly within the not-for-profit sector. He encouraged me to approach the project with a balance of technical innovation and practical application, ensuring that the outcome both strengthens my skills and adds tangible value to the organisation.
Infoxchange All Staff Town Hall 27 May 2025
The All Staff Town Hall offered a meaningful glimpse into an organisation that’s balancing appreciation for its people with a forward-looking mindset. The session opened with a strong focus on purpose and inclusivity, while also celebrating team contributions and leadership across different areas. A standout moment was the update on the evolving approach to AI emphasising hands-on exploration, ethical use, and the importance of staff-led innovation. What really stood out was the encouragement of curiosity, open dialogue, and cross-team collaboration. Overall, the meeting reflected a culture that values recognition, transparency, and thoughtful progress.
Infoxchange All Staff Town Hall 30 July 2025
The All Staff Town Hall highlighted Infoxchange’s strong focus on purpose, innovation, and collaboration. The session began with an emphasis on reconciliation and inclusivity, followed by updates on strategic priorities for the year ahead. A key highlight was the showcase of how digital tools, including AI, are being applied in practice to support community outcomes. What stood out was the balance between long-term vision and practical steps, with a clear focus on sector impact and collective progress. The meeting reinforced a culture of innovation, recognition, and commitment to social good.
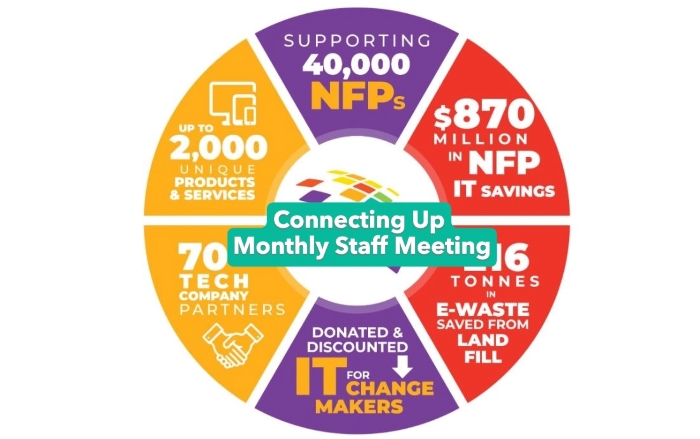
Connecting Up Staff Meeting 8 July 2025
.jpg)
On 8 July, 2025, she attended her first monthly staff meeting at Connecting Up as an intern, which offered a clear view of how company discussions are conducted. Teams shared updates on community projects, website redevelopment, customer service enhancements, and financial planning, while the Head of Connecting Up outlined upcoming initiatives and strategic goals. The meeting was a valuable chance to observe the organization’s operations and decision-making firsthand.
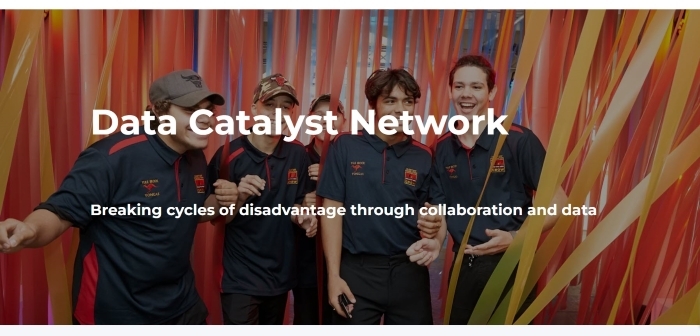 DCN May Webinar | Social Scope Sector-led Benchmarking Tool 28 May 2025
Dr Bengianni Halil-Pizzirani: Executive Manager, Innovation & Strategy, Centre for Excellence in Child and Family Welfare, Director of Research & Evaluation, Impact Initiative, Co-Founder, Synk.ai
Deb Tsorbaris: CEO, Centre for Excellence in Child and Family Welfare
David Poynter: General Manager Business Development and Research Based Models, Anglicare Victoria
Key Speaker: Dr Bengianni Halil-Pizzirani
At the Data Catalyst Network meeting, attendees were introduced to Social Scope a new, sector-owned benchmarking platform created to better support early intervention services. What stood out was how grounded and practical the platform is. Rather than imposing a one-size-fits-all model, it builds on the data organisations are already collecting, respecting the realities of frontline work. The platform also places a strong focus on data sovereignty, aiming to give smaller and Indigenous-led organisations greater control and access to their own data. With support from the Department of Treasury and Finance, Social Scope is a promising example of how data can be used not just to measure, but to empower helping reframe narratives around disadvantage through a lens of resilience and community-led insight.
DCN June Webinar | Data-Driven Collaborations: Using Population Data to Showcase Outcomes 25 June 2025
Dr. Jan Kabátek: Senior Research Fellow at the Melbourne Institute of Applied Economic and Social Research, University of Melbourne
Key Speaker: Dr. Jan Kabátek
At the Data Catalyst Network meeting, participants were introduced to two AI tools, HILDA Helper and BDB Chatbot, which ardesigned to improve access to and use of population-level data like HILDA. A live demo showed how the BDB Chatbot helps users navigate data sources and statistical terms in plain language, making complex information more accessible. The HILDA Helper supports statistical analysis by generating code and extracting insights, with human experts reviewing outputs to ensure accuracy. The session also outlined a three-layer data system: access, analysis, and communication, where the chatbot aids discovery and the Helper manages analysis. Statistics were highlighted as central to this process, with AI enhancing usability while expert oversight ensures rigour. The tools reflect a balanced approach to innovation, aiming to make data use both easier and more trustworthy.
DCN July Webinar | External Data, Internal Insights: Practical tips to Get More from your Data 24 July 2025
Kristen Moeller-Saxone: Data Capability Lead, Data Catalyst Network
Joshua Edgar: Data Specialist, Data Catalyst Network
Guest Contributors: Louise Weine, Geraldine Toh
Key Speaker: Kristen Moeller-Saxone
At the Data Catalyst Network meeting, members took part in a hands-on session designed to strengthen data capability and practical skills across the sector. The session explored approaches to data cleaning, managing quality issues such as duplicates and free-text fields, and demonstrated how tools like Excel’s Fuzzy Lookup can be used to combine and analyse datasets more effectively. What was particularly valuable was the focus on building organisational data maturity, showing how improved practices lead directly to stronger client outcomes and decision-making. The discussion also highlighted workforce development, encouraging organisations to consider roles from business analysts to data scientists and to engage interns or graduates with data skills as a way to grow internal capability. By balancing technical tools, human judgment, and collaboration, the webinar reinforced how organisations can move beyond data collection towards actionable insights that genuinely support their communities.
Let's Talk Webinar | Conference Recap & Tech Report 28 May 2025
The "Let’s Talk" session, what really stood out was Infoxchange’s focus on staying true to its purpose while continuing to grow. The announcement of a new brand positioning project created specifically for the not-for-profit sector and supported by a Melbourne branding agency offering pro bono help felt like a smart and values-driven move. It showed that the organisation is thinking long-term, but still grounded in its mission. There was also a meaningful reminder of where it all started: a small team in a garage with nothing but an idea and determination. That spirit clearly still lives on. The team’s call to support the 2025 Digital Technology Survey also highlighted how much Infoxchange values sector-wide impact. The session reinforced a strong message progress doesn’t mean losing your roots, and real impact comes from staying collaborative, focused, and people-first.
Let's Talk Webinar | The Future of Care - A Roadmap for Smarter, More Compassionate Case Management 24 June 2025
The "Let’s Talk" session offered a focused update on improving client and case management systems. Key highlights included a secure file viewer to reduce data risks, extended access to insights through the Data Warehouse pilot, and more flexible user permissions. Plans for app-based multi-factor authentication and better system integration showed a strong focus on security and usability. The session also acknowledged the importance of technical maintenance, reinforcing a practical and people-centred approach to long-term system improvement.
Let's Talk Webinar | AI Learning Community - showcasing the new community feature of the Digital Transformation Hub 6 August 2025
The “Let’s Talk” session showcased how the Digital Transformation Hub is evolving to better support not-for-profits through its new AI learning community and personalised learning personas. What stood out was the practical way the Hub is tackling sector challenges, moving beyond generic training by tailoring content to an organisation’s stage of digital readiness, whether cautious beginners or confident adopters. The introduction of a structured content framework, combining big-ticket insights with ongoing updates, reflected a clear focus on making learning accessible and sustainable. Equally important was the emphasis on building confidence, reminding participants that experimenting with AI is a shared journey where no one is starting alone. With the launch of an upcoming survey to map AI learning personas, the session reinforced the Hub’s commitment to creating resources that are relevant, sector-specific, and grounded in the realities of not-for-profit work.
 Infoxchange's Biggest Morning Tea - Cancer Council 17 June 2025
Help Cancer Council raise much needed funds that go towards vital cancer research, support services, prevention programs, and advocacy.
Website Re-development Meeting 27 June 2025
In discussion with Kristen Moeller-Saxone, Data Capability Lead, the conversation focused on web development challenges, particularly the difficulty of transitioning from open-ended data fields to more structured formats without excluding niche or unique service entries. A key concern was how to effectively clean and standardise existing free-text data to align with closed selection systems. The exchange also highlighted the importance of thoughtful data architecture and backend support to ensure systems remain flexible, scalable, and user-friendly. Overall, the discussion reflected a practical and collaborative effort to improve data quality and platform usability while respecting the diverse needs of service users.
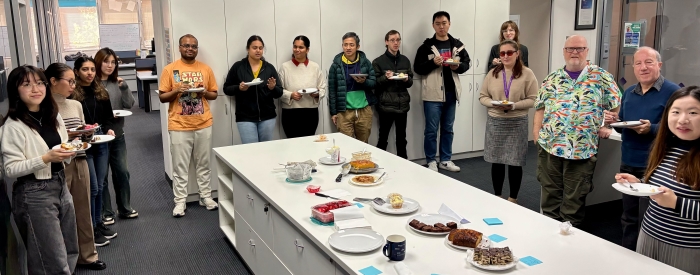
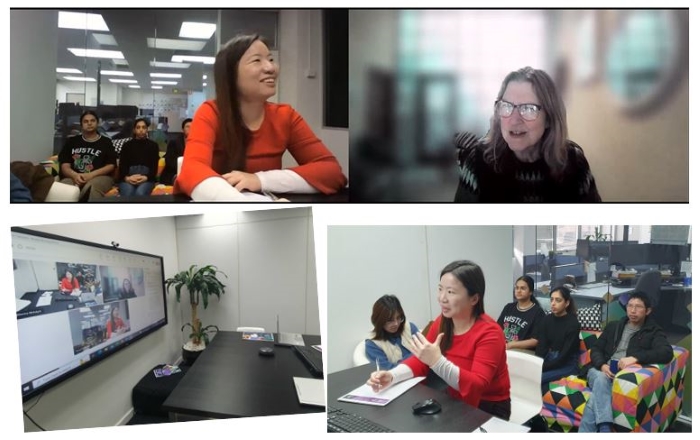
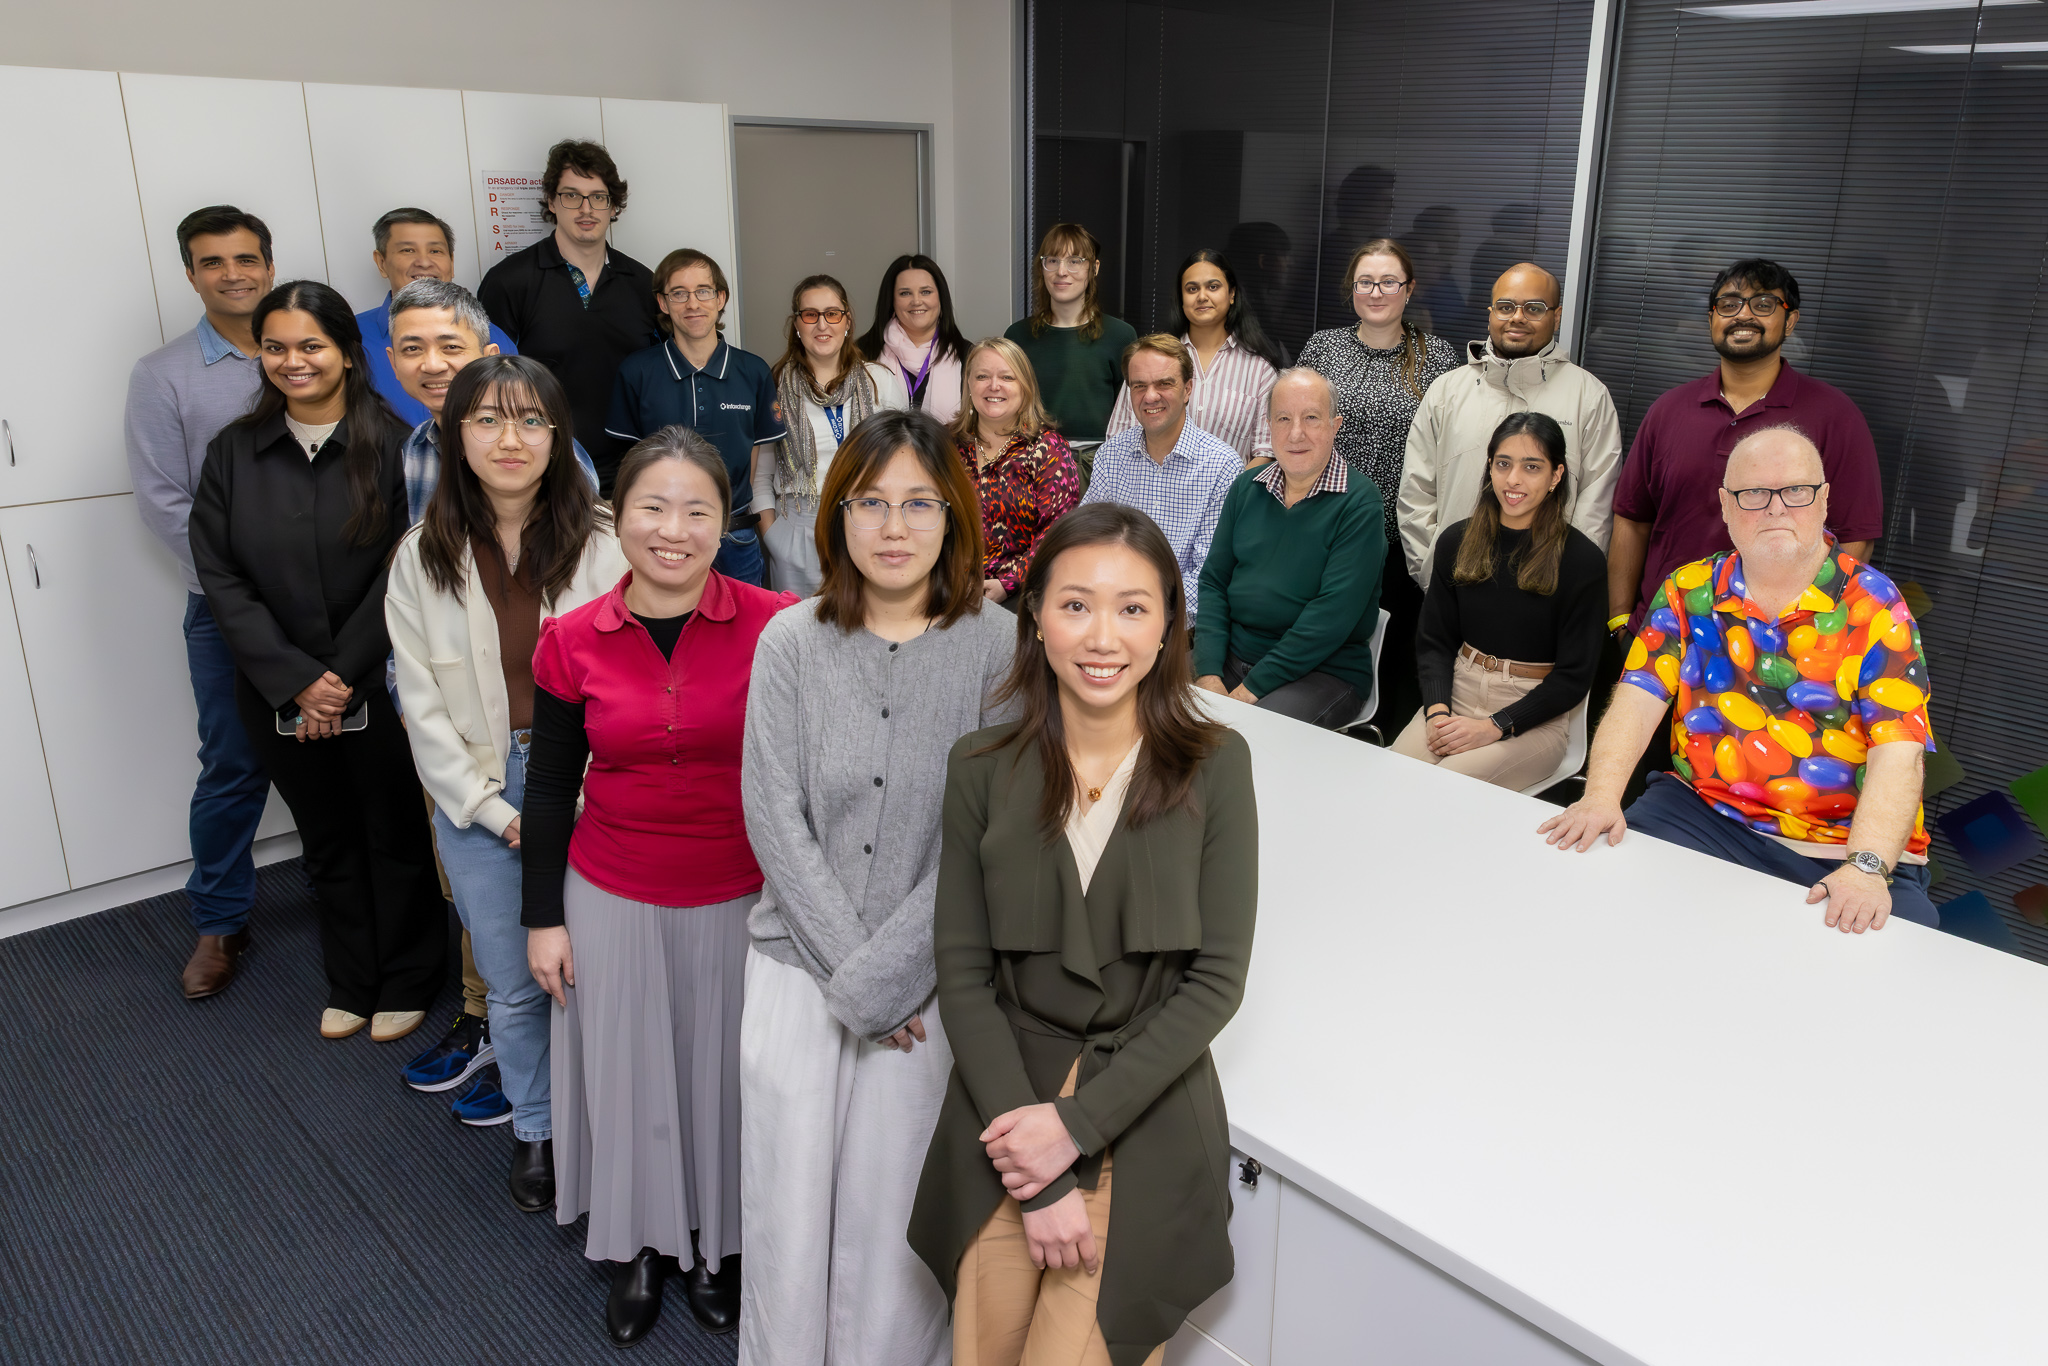
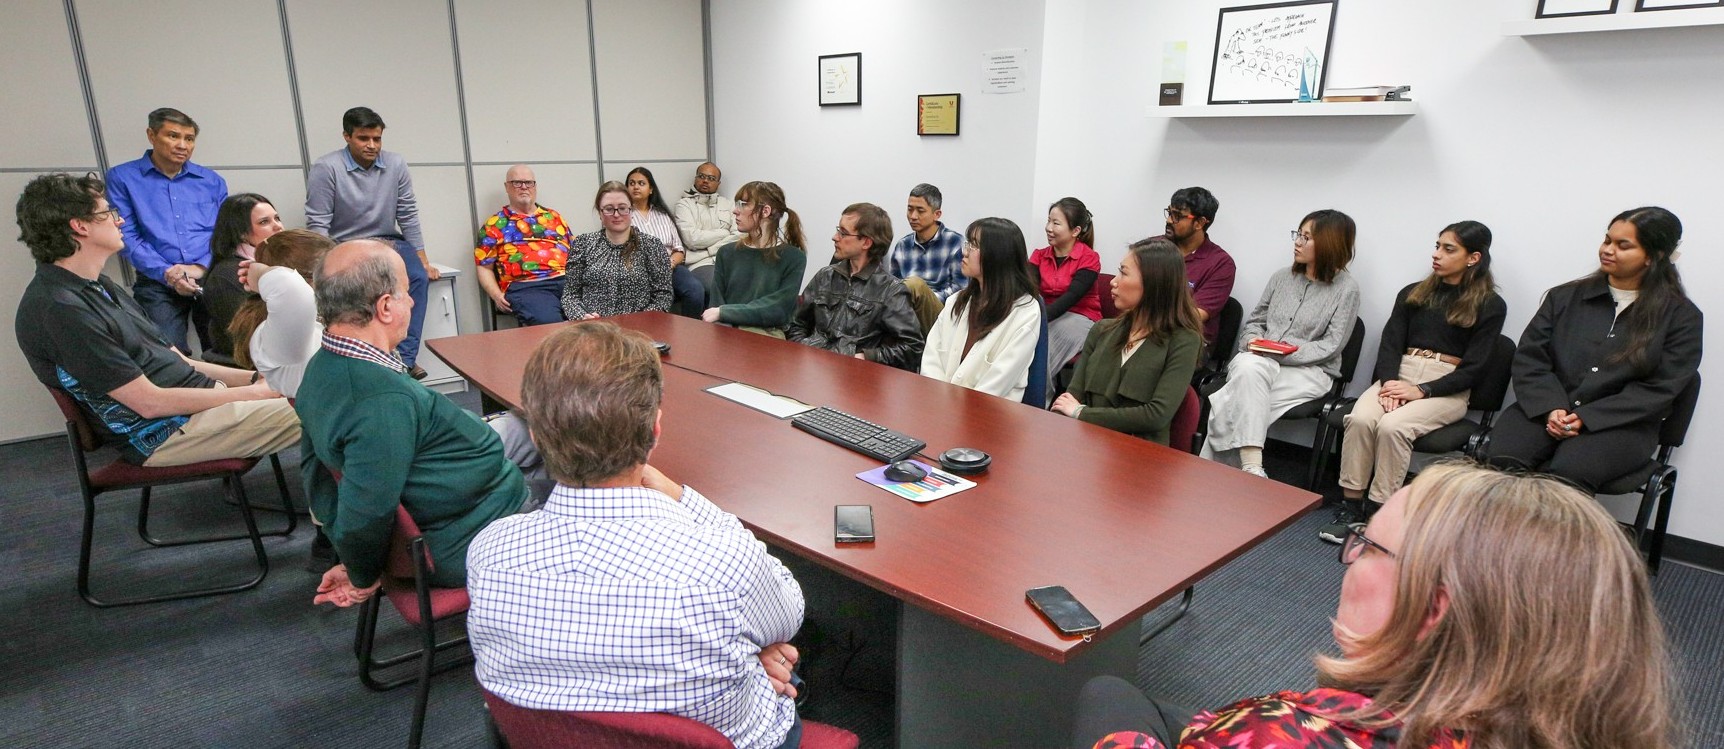 Infoxchange Jo Davies COO and David Spriggs CEO Visit 25 July 2025
David Spriggs, CEO, and Jo Davies, COO, from the Melbourne office visited Adelaide to meet with staff and interns for a Q&A session on organisation-wide strategic directions. The session was followed by an informal company lunch, which created a great opportunity to connect with the executive leadership, share ideas, and enjoy time together in a relaxed setting.
Intern Shrushti Ladage and Charmi Divecha at the IX Lunch
 Digital Training & Development
Volunteers and interns have access to the Connecting Up Digital Learning Platform, which offers live and recorded webinars, workshops, and webcons led by subject-matter experts on various technology topics relevant to the not-for-profit sector. Charmi selected, attended, summarized, and evaluated relevant training sessions to explore how they could enhance her internship experience:
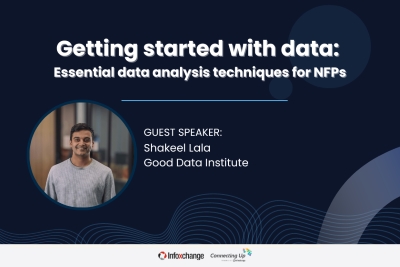
CU webinar: Getting Started with Data: Essential Data Analysis Techniques for NFPs
The webinar was presented by Shakeel Lala, Director of People and Culture at the Good Data Institute (GDI), offered a practical and engaging introduction to foundational data analysis tailored for not-for-profit organisations. He walked participants through the key stages of the data project lifecycle defining objectives, understanding available data, performing analysis, and taking action. Using a real-world dataset from the Australian Charities and Not-for-profits Commission (ACNC), he demonstrated step-by-step how to clean and prepare data in Excel, calculate metrics such as donation reliance, and use pivot tables for summarising financial information.
A significant part of the session focused on interpreting income sources across different charity sizes, helping organisations identify patterns in funding diversity and financial stability. He emphasized the importance of thoughtful categorisation when segmenting data, noting that poorly chosen thresholds could misrepresent underlying trends. His use of simple visual tools, such as 100% stacked column charts, made complex datasets easier to understand. The webinar provided valuable insights for NFP professionals looking to strengthen their data literacy and apply practical techniques to drive informed decision-making.
This webinar helped me understand how to approach data analysis in a structured way, especially for not-for-profit organisations. I learned how to clean and format data in Excel, use pivot tables, and interpret key insights through visualizations. The practical examples boosted my confidence in analysing financial data and applying it to real-world decision-making.
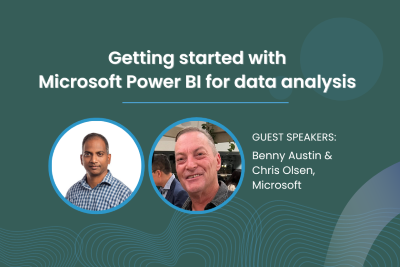
CU webinar: Getting started with data: Microsoft Power BI for data analysis
The webinar was presented by Chris Olsen, offered a clear introduction to Power BI as a leading tool for business intelligence and data visualization. Chris explained how Power BI connects with a wide range of data sources from cloud platforms and databases to Excel files and outlined the key components of the ecosystem, including Power BI Desktop, the Power BI Service, and the newer Microsoft Fabric platform. He also discussed Power BI’s regular updates and strong integration with other Microsoft tools.
Chris walked through the full Power BI workflow: connecting to data, transforming it using Power Query, building data models, and creating interactive visuals. He explained the differences between import, direct query, and composite models, along with the benefits of the new DirectLake mode. A live demo showed how to connect to an Azure SQL database, clean and shape data, and build relationships across tables. The session also covered using DAX for custom measures and bookmarks for storytelling within reports.
This webinar helped me understand how to approach data analysis using Power BI in a structured, practical way. I learned how to clean data, build models, and create clear visual insights. The examples and explanations gave me the confidence to start using Power BI in real projects.
CU webinar: Too Much Data, Too Little Time: Using NotebookLM to strengthen your data processing
The webinar was led by Li-Yi Shao and Jed Adao from TechSoup Asia-Pacific, and it provided an accessible introduction to Google’s emerging AI tools, with a strong focus on NotebookLM. The presenters explained how NotebookLM works as a research assistant that helps nonprofits condense, interpret, and share information from multiple sources. They also positioned NotebookLM alongside Google’s other AI offerings, such as Gemini, Audio Overview, and Mind Maps, showing how each fits into different stages of the data cycle.
The session demonstrated how NotebookLM can support nonprofit professionals in real situations; summarizing meeting notes for leadership, quickly getting up to speed on new topics for grant applications, and turning extensive FAQs into shareable documents for staff across different sites. The presenters highlighted that while Gemini is versatile for generating and exploring data, NotebookLM is especially powerful for compressing, synthesizing, and presenting insights in formats that are easy to absorb and distribute.
Through step-by-step scenarios, the webinar showed how NotebookLM reduces the time and effort needed to handle large amounts of information. I came away understanding how the tool can speed up everyday nonprofit tasks like reporting, research, and collaboration. The session gave me a clear picture of where NotebookLM adds value, and how pairing it with Gemini can make data-heavy work more manageable and efficient.

CU webinar: RAG fundamentals and implementation basics
The webinar introduced participants to the foundations of large language models and how Retrieval-Augmented Generation (RAG) can be applied in practical settings. The presenters explained how RAG systems combine the strengths of generative AI with external knowledge retrieval to produce more accurate, context-aware outputs. They highlighted the relevance of this approach for social impact organizations, showcasing case studies where RAG improved information access and decision-making.
A key focus of the session was on the phases of implementing RAG in real-world use cases. The discussion covered resource planning, throughput benchmarking, scalability considerations, and build-versus-buy evaluations. Participants were shown how to align technical implementation with organizational goals, while ensuring compliance with data privacy regulations and designing for iterative improvement based on stakeholder feedback.
The webinar also included a live demo of Omdena’s RAG-based products, offering a practical view of how the technology works in action. Beyond the technical aspects, significant attention was given to the ethical and explainable AI dimensions of RAG. The framework emphasized transparency through metadata logs, bias monitoring, encryption and anonymization for privacy, inclusive design principles, and human oversight in critical decision-making.
Overall, the session provided a balanced perspective on both the technical mechanics and ethical responsibilities of deploying RAG. I came away with a clearer understanding of how to evaluate, design, and implement RAG systems in a way that maximizes value while addressing risks such as bias, misinterpretation, and data security.

CU webinar: Research smarter, not harder: AI tools for writers & analysts
The webinar was presented by Kyle Behrend, an AI consultant and founder of AI Impact Hub, and it focused on how writers, researchers, and analysts can use modern AI tools to make their work more efficient. Kyle began with an overview of the progression of AI capabilities from simple text completion, to conversational models, to emerging agent-based systems and posed the key question of whether AI can be trusted to deliver “truth” versus plausible-sounding but inaccurate information.
The session introduced a range of AI-powered research tools including OpenAI Deep Research, Perplexity, and Grok, alongside demonstrations of how to use AI search effectively. A practical portion explained how to phrase and refine prompts to guide these systems toward more relevant and reliable results. Kyle also showed how outputs can be exported for further use, supporting smoother integration into existing research and writing workflows.
Throughout the webinar, the emphasis was on using AI to research smarter rather than harder—helping professionals save time, expand the scope of sources they consider, and reduce manual effort. I left with a better understanding of which tools to try, how to structure my queries, and how to critically assess AI-generated information for accuracy and context.
 (original).jpg)
Photo with SAcommunity people and volunteers: Rex, David, Jacinta and inters Glenice, Bethany, Mahir
Final Reflection
During my internship with SAcommunity at Connecting Up, I had the opportunity to apply and extend the skills I have been building through my academic journey in data science. My main project on the City of Onkaparinga’s community services dataset gave me end-to-end exposure to real-world data work from cleaning and standardising multi-year datasets, to consolidating them into a master file, and finally developing interactive Power BI dashboards that revealed meaningful insights for council stakeholders. Alongside this, I worked on validating and enhancing playgroup listings, which not only improved data accuracy but also strengthened the usefulness of the platform for local families and communities.
Through this experience, I refined my technical abilities in Python, Power BI, and data visualisation while also developing important professional skills in communication, stakeholder engagement, and problem-solving. Attending staff meetings, training sessions, and webinars allowed me to broaden my understanding of how data is applied across sectors, while my mentor discussions highlighted the growing importance of combining technical expertise with financial and business knowledge. These experiences gave me a more holistic view of the role of a data professional—someone who not only manages and analyses information, but also translates it into insights that guide decisions.
This project has been particularly valuable because it brought together many attributes of data science such as data cleaning, preparation, integration, visualisation, and communication into one comprehensive learning journey. Looking ahead, I am confident that these skills and experiences will support my future goal of building a career as a Data Analyst or Data Scientist, particularly within the finance sector. The internship has given me both the technical depth and the practical perspective needed to bridge the gap between data and business outcomes, which is the foundation of the career path I aspire to pursue.
 Meeting and Lunch with David Spriggs CEO, and Jo Davies COO of Infoxchange (Melbourne) at Infoxchange Adelaide Office with staff and interns 25 July 2025
