![]()
![]()
![]()
Adelaide University Internship Experience - Shrushti Rajendra Ladage

Welcome Shrushti!
Shrushti Rajendar Ladage has joined our Data Analytics Team for her Adelaide University SET Internship for Data Science for Trimester 2, 2025, 27 May 2025 - 1 August 2025.
She completed her 140 hours internship onsite with SAcommunity at the Connecting Up Office, Infoxchange 14 hours a week for 10 weeks over 2 days around her university classes. After her internship she returned to the organisation on 13th March 2026 as a volunteer in the data analytics team.
Total Hours: 148 This Year: 8 Joined: 13 March 2026 Last Check-in 20 March 2026
Personal Biography
Shrushti is in her final term of her Masters of Data Science at the University of Adelaide. She holds a Bachelor's degree in Computer Applications from Amity University, India. Here she gained experience as an AWS Cloud Intern at F13 Technologies. She also works as a part-time at Woolworths, a contributor to the On-Dit magazine and as a YouX Volunteer at Uni around her studies. Recently, she has been selected into the ThincHer Program 2026 as one of the 20 participants.It's a wounderful opportunity for her to make new connection, improve her communication, focus on personal growth, wellbeing, engage in discussions and strengthen leadership skills.
At Connecting Up, Infoxchange she joined the Data Analytics Team. Through this internship, she has expand her skill set by learning tools such as Google Analytics and Power BI, enhancing her soft skills, and building meaningful industry connections.
Looking ahead, Shrushti aims to pursue a career as a Risk Analyst in the Technology and Cloud industry. She is particularly keen to apply her analytical and cloud skills to help protect data because she enjoys anticipating potential problems and figuring out how to prevent them.
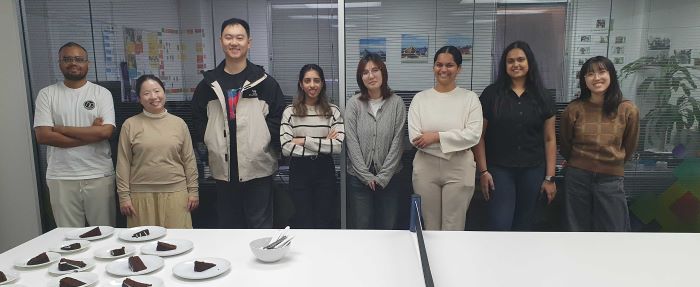
From left to right Intern Mahir, Volunteers Yong Kheng Beh and Joe Xanqiao Zhang, Interns Charmi Divecha, Meixuan Liao,Shrushti Rajendra Ladage, Deekshitha Goud Podeti and staff member Julia Koh (Former intern)
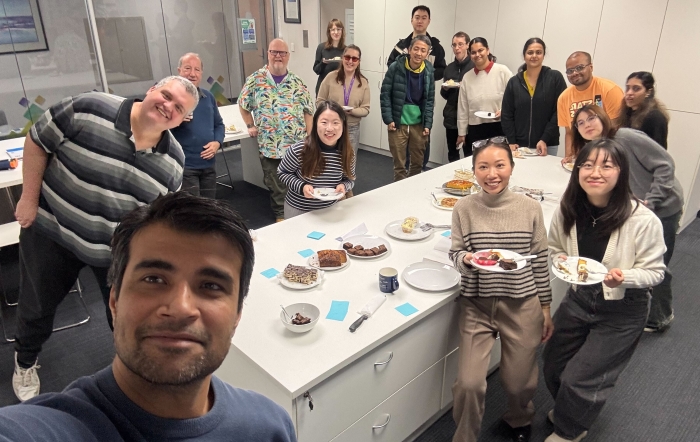
Induction And Orientation For Interns
The interns received a warm welcome from the Connecting Up team, coinciding with the celebration of National Volunteer Week in Australia, which was marked with cake. Interns, volunteers, and staff members introduced themselves through brief elevator pitches, helping everyone get to know one another better. The gathering not only highlighted the diverse backgrounds and passions within the team but also laid the groundwork for meaningful connections and shared purpose moving forward.It was a fun, easy way to break the ice and start getting to know each other, setting a friendly and positive tone for what’s to come.
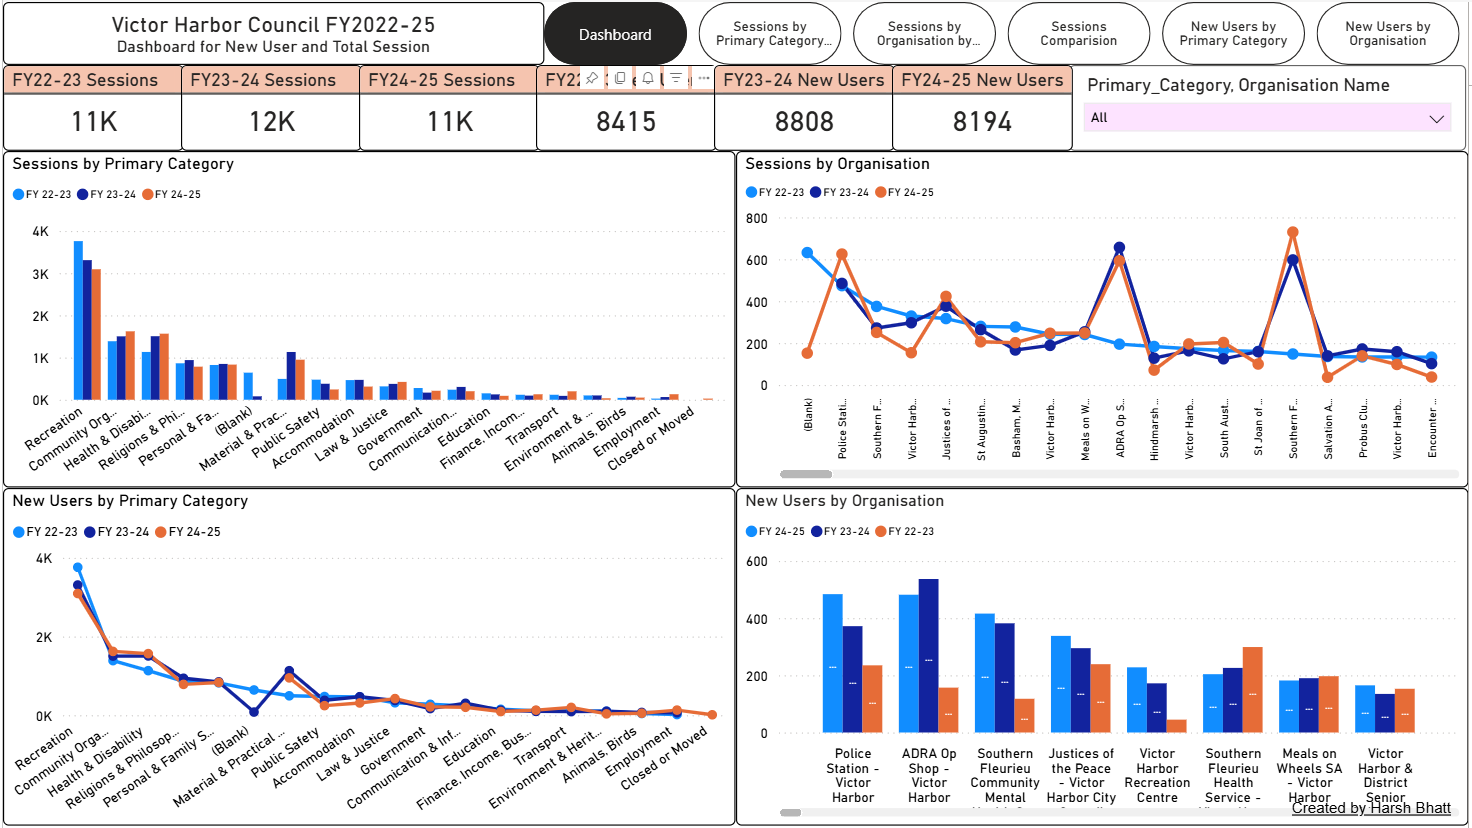
Shrushti has selected the Victor Harbor Council dataset for her Power BI and Canva council report, the dataset of 241 community services operating in the area for the financial years 2022-2023, 2023-2024 and 2024-2025. Her reports followed previous visualization report work by Jesslyn Dali, and her completed report can be found>>here.
There are a number of steps involved in the creation of community service information data presentations. A summary of data trends prepared, using information from Google Analytics and SAcommunity with subsequent Power BI and Canva reports revealing data anomalies and corrections required, the database is updated and reports re-created with improved information. Final data reports are published on the website and introduced by Shrushti to Victor Harbor council stakeholders for information and/or feedback.
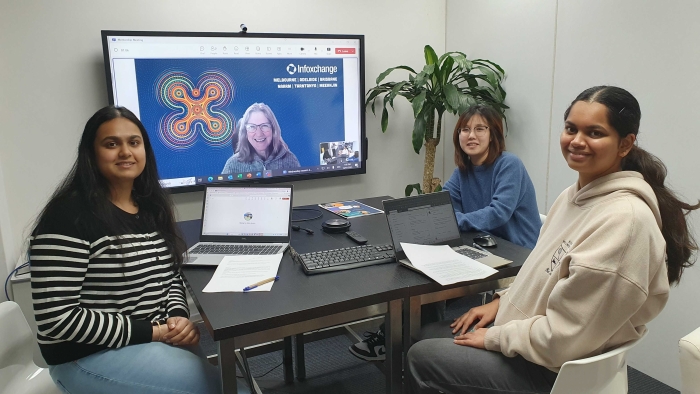
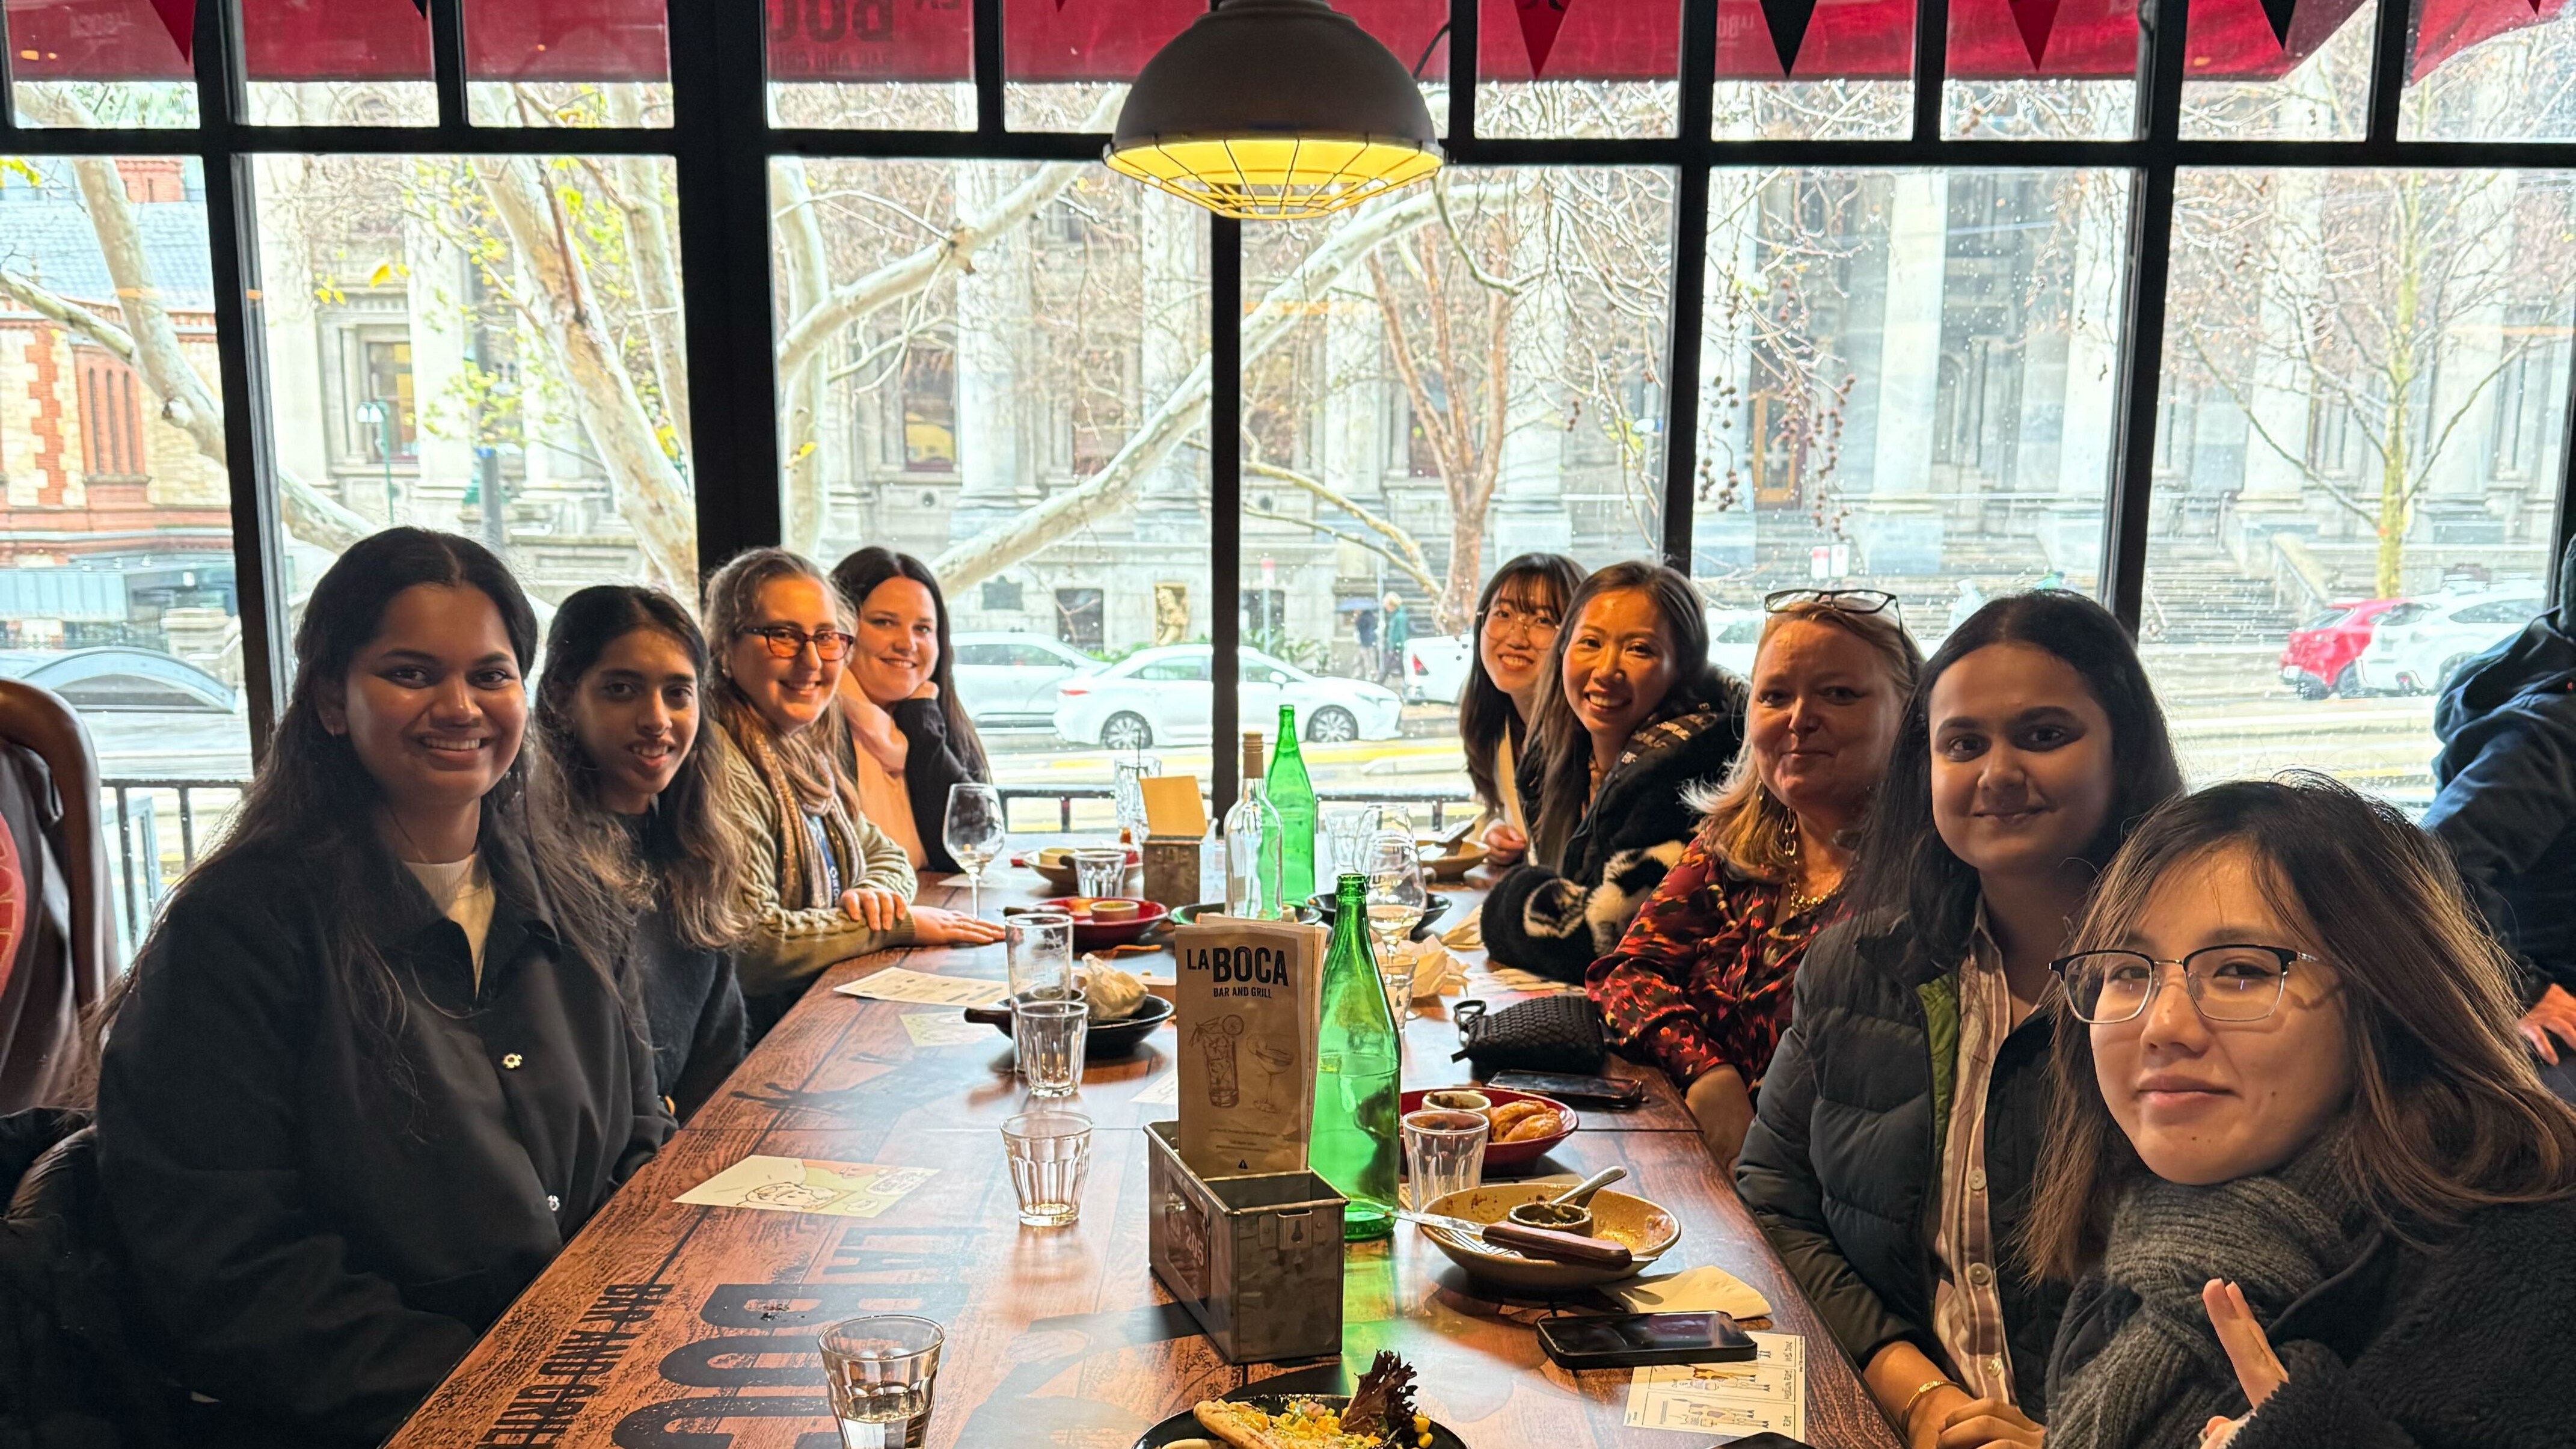
Deekshitha, Kristen Moeller Saxone, Meixuan, Shrushti
Infoxchange
Mentoring Program | 25th July, 2025The Connecting Up mentorship initiative helps interns choose their mentors and have 30-minute guidance sessions. Designed to bolster career growth and skill-building, the program offers tailored advice for specific roles, fosters connections across teams, highlights pertinent training, and encourages involvement in both work and social activities. This supportive framework creates a collaborative partnership, empowering motivated mentees to acquire and apply new competencies.
My Session with Kristen Moeller-Saxone
I got an opportunity to choose Kristen Moeller-Saxone, Data Capability Lead for Infoxchange’s Digital Transformation Hub as my Mentor. She generously walked me through her career detailed her daily responsibilities, and offered actionable strategies for translating academic Data Science know-how into tangible business value and social-impact roles. This mentoring conversation with Kristen was incredibly insightful and it was a pleasure meeting with her. She gave real-world examples and career insights which clarified the blend of technical, strategic, and interpersonal skills needed to thrive as a data professional especially within the nonprofit sector. I’m inspired to apply her guidance on translating analysis into action, building my network, and embracing a mindset of fast iteration and continuous learning.
I got an opportunity to choose Kristen Moeller-Saxone, Data Capability Lead for Infoxchange’s Digital Transformation Hub as my Mentor. She generously walked me through her career detailed her daily responsibilities, and offered actionable strategies for translating academic Data Science know-how into tangible business value and social-impact roles. This mentoring conversation with Kristen was incredibly insightful and it was a pleasure meeting with her. She gave real-world examples and career insights which clarified the blend of technical, strategic, and interpersonal skills needed to thrive as a data professional especially within the nonprofit sector. I’m inspired to apply her guidance on translating analysis into action, building my network, and embracing a mindset of fast iteration and continuous learning.
Shifting from Academia to Industry
Kristen’s transition involved moving away from open-ended research toward fast-paced, KPI-driven analytics. She urged me to adopt an iterative mindset: reuse proven methods to meet deadlines, align work with business metrics, and collaborate effectively within real-world constraints.
Communication & Networking
She highlighted that translating technical findings into plain-language, decision-ready messages and building relationships so they’re heard is as vital as the analysis itself. She recommended joining associations like DAMA to engage in conversations centered on “data for business issues” rather than purely technical topics, and to practice data storytelling and cross-functional collaboration early on.
Ongoing Professional Growth
She attributes her sustained development to continuous, community-based learning beyond formal qualifications. By attending events, engaging with professional groups, and reflecting on project experiences, she keeps her skills aligned with the impact she aims to create. Kristen suggested setting a regular personal-development schedule to stay current and purposeful.
Linking Analysis to Decisions
She also stressed that it’s easy to get lost in algorithms and visualization tools while overlooking the core business question. She’s seen dashboards brimming with charts but missing the “so what” the clear recommendation or action step. Her advice: always tie your insights back to a concrete decision, and learn the fundamentals of data ownership, governance, and quality control from the start.
Advancing Toward Leadership Climbing the ladder, she explained, demands more than coding expertise it requires a grasp of organizational context, stakeholder needs, and overall impact. Kristen’s involvement in professional bodies like DAMA and DCN widened her perspective beyond analytics. She encouraged me to build project-management skills, nurture a broad network, and sharpen my ability to engage stakeholders, all while maintaining technical proficiency.
Town Hall Meeting
At the Infoxchange All-Staff Town Hall, everyone from various teams to interstate offices came together to share updates and learn about each other’s work. Held alongside our intern orientation, the session offered a behind-the-scenes look at how the company integrates GenAI into both internal processes and client-facing tools, all aimed at helping nonprofits streamline their data.
I discovered how different departments collaborate to support community groups and disaster-relief
efforts and gained a clear picture of how Infoxchange secures and manages funding to safeguard sensitive information. Overall, it was an excellent introduction for us interns, giving me valuable insight into the organization and showing how our upcoming projects will make a real impact.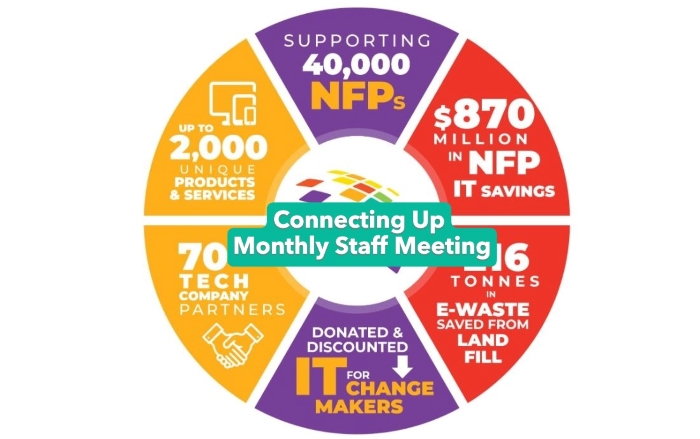
Connecting Up | Monthly Staff Meeting
I attended our monthly staff meeting, which offered valuable insights into the company’s ongoing activities. I also had the opportunity to present an update on my own progress. During the meeting, I learned about next week’s “Morning Tea” to support cancer foundation . Overall, the meeting was an excellent way to understand each team’s activities and ensure everyone stays aligned.
Cancer Council 17 June, 2025. Help Cancer Council raise much needed funds that go towards vital cancer research, support services, prevention programs, and advocacy.
It was a great pleasure to take part in Infoxchange's Biggest Morning Tea in support of the Cancer Council. It was truely heartwarming to see our team come together for such a meaningful cause.
What made this event more special? Many of the delicious cakes and treats were baked by over talented staff ! Events like this remind me how powerful community and compassion can be in both raising funds and spirits.
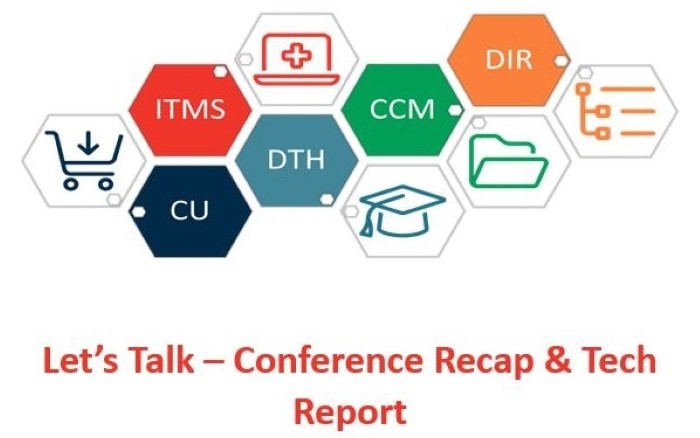
Let's Talk Webinar | Conference Recap & Tech Report 28 May 2025
Attending the “Let’s Talk” session underscored how Infoxchange remains deeply committed to its founding mission even as it scales. I was particularly impressed by the announcement of a new brand-positioning initiative, crafted specifically for the not-for-profit sector. This move felt both strategically savvy and values-driven showing that growth and purpose can go hand in hand.
A highlight for me was the reminder of Infoxchange’s humble beginnings: a small team working out of a garage with little more than an idea and determination. That pioneering spirit clearly continues to guide the organisation’s culture and decision-making. The session’s call to back the 2025 Digital Technology Survey also drove home how much Infoxchange values sector-wide collaboration and impact.
Overall, the webinar reinforced a powerful message: meaningful progress doesn’t require abandoning your roots. True impact comes from staying collaborative, focused, and people-first, and I left feeling inspired to contribute to both our brand evolution and ongoing efforts to support the broader nonprofit community.
Let's Talk Webinar | The Future of Care - A Roadmap for Smarter, More Compassionate Case Management 24 June 2025
In the June 24, 2025 “Let’s Talk” webinar on The Future of Care: A Roadmap for Smarter, More Compassionate Case Management, the team outlined targeted enhancements to our case and client management tools. They introduced a secure file viewer to curb data risks, broadened insight access through the Data Warehouse pilot, and rolled out more adaptable user-permission settings.
Upcoming features such as app-based multi-factor authentication and tighter system integrations underscore our dual commitment to security and ease of use, while a renewed focus on ongoing technical upkeep highlights a practical, people-centred approach to sustainable improvement.
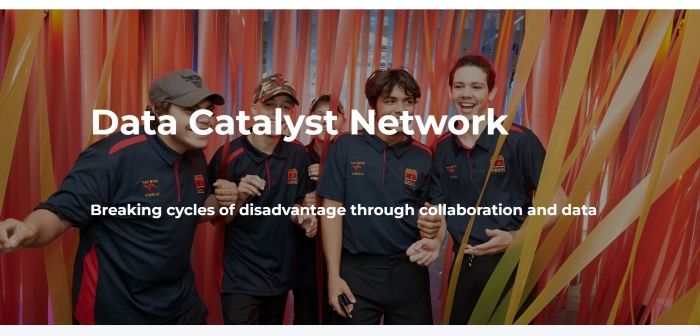
Data Catalyst Network (DCN)
The Data Catalyst Network, is a cross-sector collaboration created to enable not-for-profit organisations working to support children, families and communities to use data more effectively to shape services and achieve their outcomes and generate new insights to better disrupt cycles of disadvantage.
Data Catalyst Network Meetings are held monthly and volunteers and interns are invited to attend to understand how nearly 70 organisations are working with data from the not-for-profit community sector alongside academics, government bodies, and business professionals.
Data Catalyst Network | Discussion of Social Scope Project 28 May 2025
Deb Tsorbaris, CEO, Centre for Excellence in Child and Family Welfare
David Poynter, General Manager Business Development and Research Based Models, Anglicare Victoria,
Dr Bengianni Halil-Pizzirani, Executive Manager, Innovation & Strategy, Centre for Excellence in Child and Family Welfare, Director of Research & Evaluation, Impact Initiative, Co-Founder, Synk.ai.
I attended a Data Catalyst Network meeting where Benjamin Halil-Pizzirani was the key note speaker. He discussed the need for the Social Scope project. During the meeting, a prototype of the Social Scope platform was presented, and its features designed to simplify data use and enable secure, collaborative, and user-centred reporting were explained. He emphasised that the project was initiated in response to the data challenges faced by not-for-profit (NFP) organisations in 2024.
A major issue highlighted was the lack of effective systems for evidence-based decision-making: only one in three NFPs have processes to manage informed security-related risks, while 77% reported that their systems do not. Furthermore, only one in four organisations believe their data quality adequately supports reporting needs. These insights reinforced the importance of a practical and ethical data tool like Social Scope to support impact measurement across the social services sector.
Data Catalyst Network | Data-Driven Collaborations: Using Population Data to Showcase Outcomes 25 June 2025
Dr. Jan Kabátek is a Senior Research Fellow at the Melbourne Institute of Applied Economic and Social Research, University of Melbourne. He specializes in labor economics, family dynamics, gender, and ageing, using large-scale administrative data for empirical research. He also leads the Melbourne Institute’s AI Group, focusing on the intersection of artificial intelligence and social science.
On 25 June 2025, the Data Catalyst Network hosted a webinar entitled “Data-Driven Collaborations: Using Population Data to Showcase Outcomes,” led by Dr. Jan Kabátek, Senior Research Fellow at the Melbourne Institute of Applied Economic and Social Research, University of Melbourne. During the session, attendees met two AI-powered assistants HILDA Helper and the BDB Chatbot built to streamline how researchers engage with large-scale population datasets like HILDA.
In a
live demonstration, the BDB Chatbot translated complex data sources and statistical jargon into everyday language, making it easier to explore and understand the information. Meanwhile, HILDA Helper showed how it can automatically generate analysis scripts and pull out key insights, with domain experts reviewing each result to guarantee reliability. The talk also laid out a three-layer data framework access, analysis, and communication where the chatbot accelerates discovery and the Helper drives the analytical work. By pairing AI’s efficiency with expert oversight, these tools aim to make population data both more accessible and more dependable.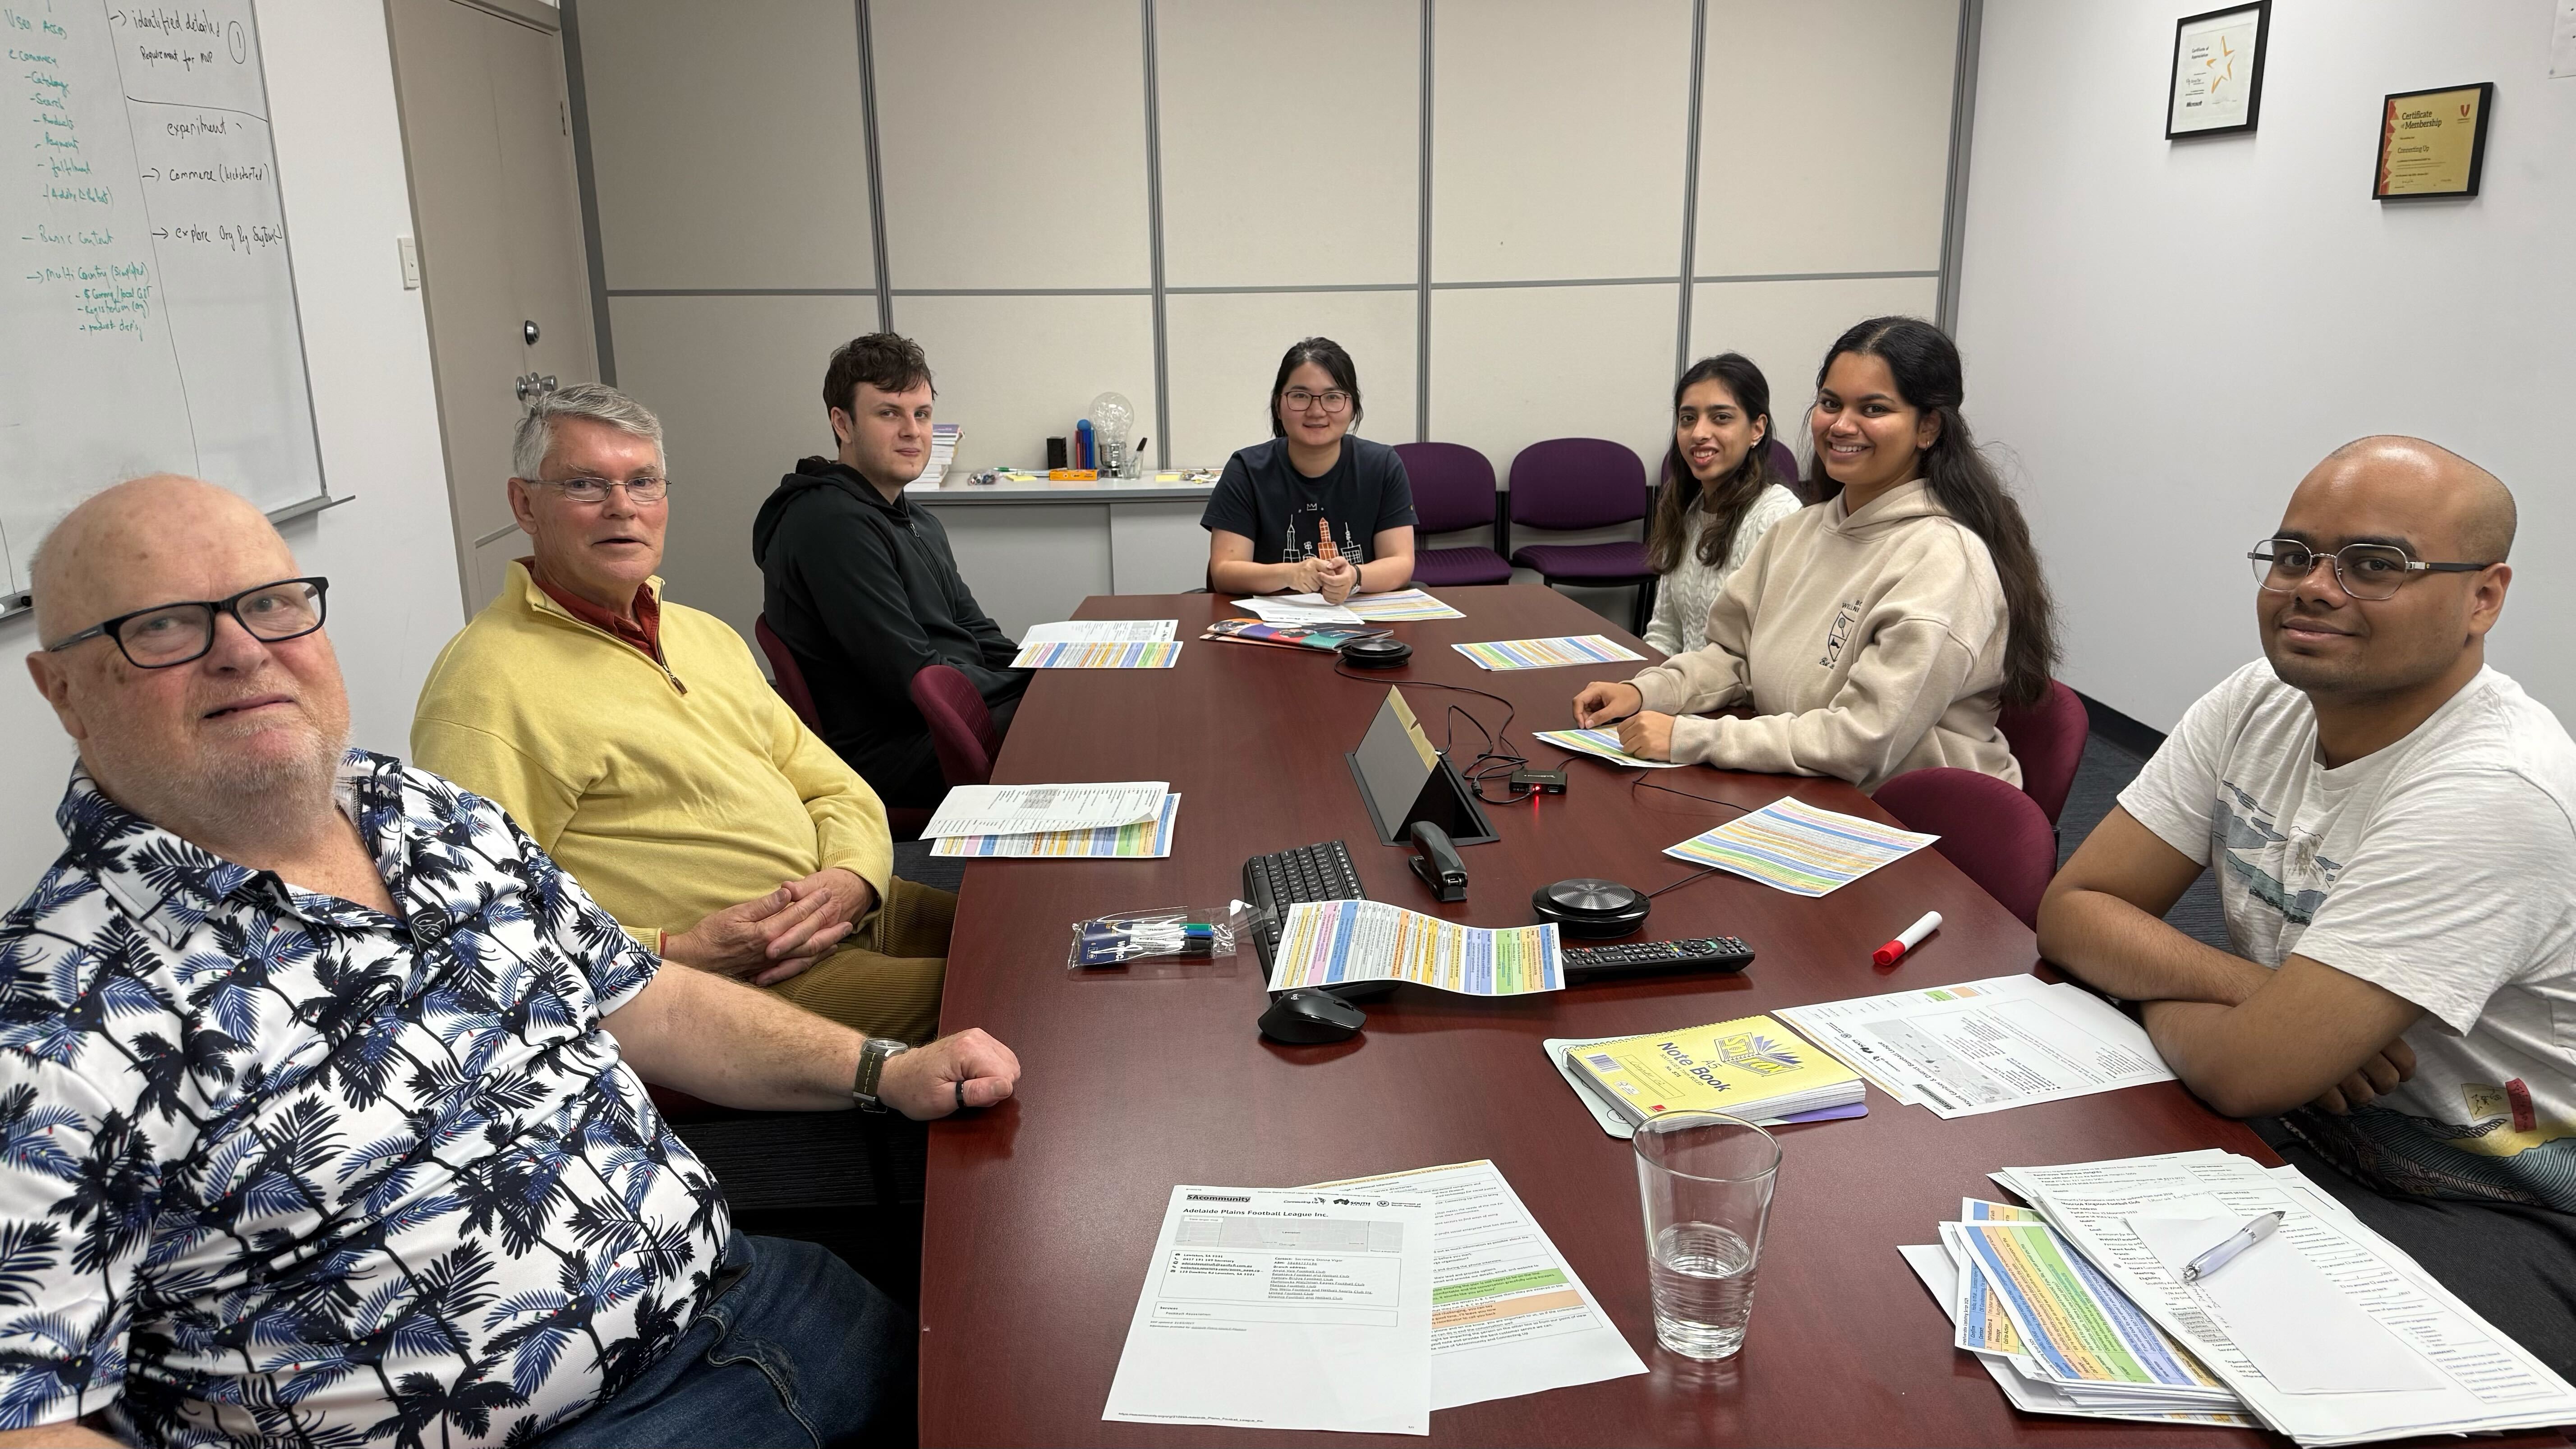
Telephone Techniques | 9th May,2025
During the Telephone Techniques training, I had the opportunity to practice with Waleed Sayeed. He guided me through the training and shared some valuable tips and tricks that will be helpful when contacting councils or other organisations.
The telephone techniques are closely linked to email and communication strategies, which support Data Analytics Team members in better understanding the directory and data collection methods. These skills also play a key role in data cleaning, updating individual datasets, and ultimately presenting data reports to council stakeholders.
Like the student elevator pitch sessions, the Telephone Techniques meetings emphasise the importance of practice – the more we practice, the more confident and effective we become.
Company Lunch | 25th July, 2025
It was a pleasure meeting David Springs (CEO) and Jo Davies (COO) of Infoxchange, who flew in from the Melbourne office to visit us in Adelaide.The company lunch was an amazing experience to connect with David and Jo, share thoughts, valuable experiences and enjoy quality time with colleagues in a relaxed setting and have good food.
As an international student who is trying to understand the Australian work cultural this was my first hand experience and I must say it was truly enjoyable. Moments like these make work feel even more fulfilling. I'm definitely looking forward to many more lunches like this in the future!
 Digital Training & Development
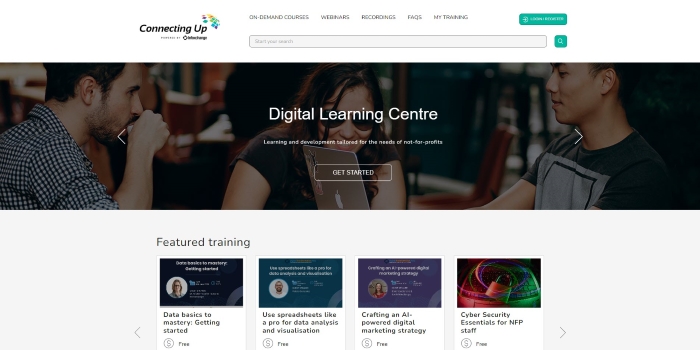
Volunteers and interns have access to the Connecting Up Digital Learning Platform, which offers live and recorded webinars, workshops, and webcons led by subject-matter experts on various technology topics relevant to the not-for-profit sector. Shrusthi selected, attended, summarized, and evaluated relevant training sessions to explore how they could enhance her internship experience:
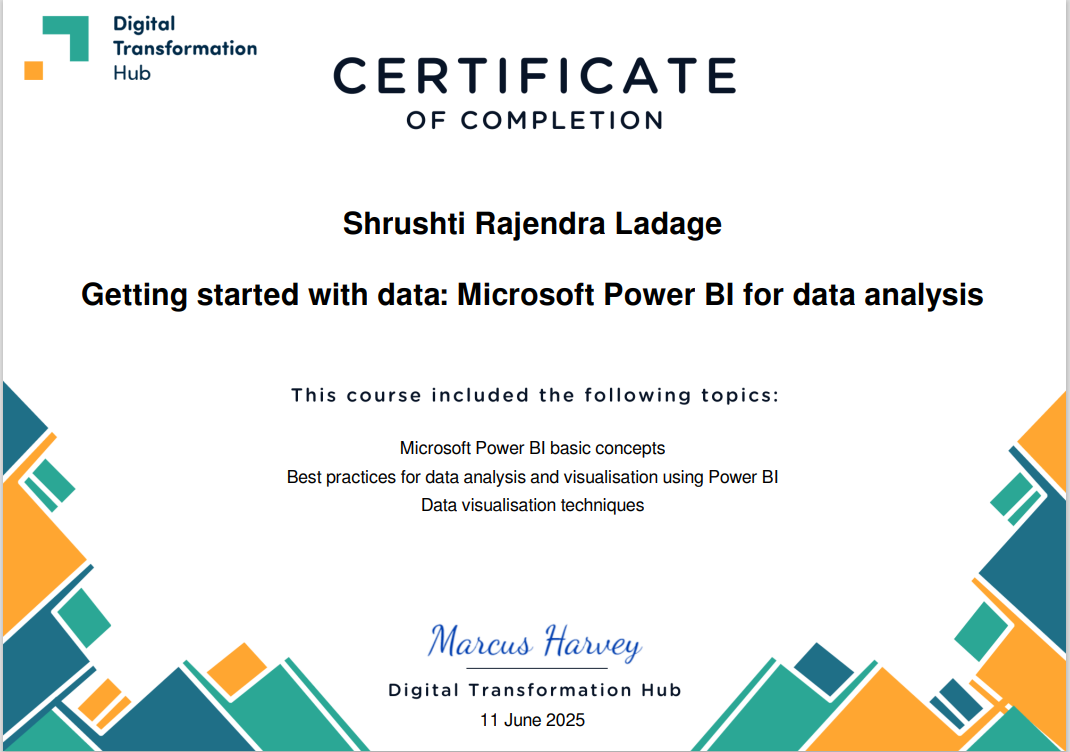
CU Webinar - Getting started with data: Microsoft Power BI for data analysis
The Power BI webinar provided valuable insights into how data can be transformed into meaningful information for better decision-making. I learned that Power BI acts as a bridge between raw data and actionable insights, allowing users to analyze, visualize, and share data efficiently. As a Software as a Service (SaaS) platform, it offers flexibility and can be used across various environments, including Microsoft Teams, web applications, and mobile devices.
The webinar also introduced Power BI's ability to create custom visualizations and embed interactive visuals into presentations, enhancing engagement and clarity. One of the key takeaways was how Power BI supports collaboration, enabling users to share data across teams, organizations, and even with customers.
The Power BI product portfolio was explained in detail, covering aspects such as Authoring, Sharing, Large-Scale Deployment, and App Development. A live demonstration showed how to connect Power BI to different data sources like Excel and Oracle, which helped me understand the importance of understanding your data structure when creating effective visuals.
Overall, the webinar helped me understand the end-to-end process of using Power BI from connecting to data, building visuals, and sharing insights. It was a practical and informative session that deepened my appreciation for data visualization tools.
What resonated with me are the several features spoke directly to the challenges I face when wrestling with disparate data sources and tight deadlines. As someone who constantly toggles between CSV exports, PDF reports, and meeting transcripts, I was particularly struck by how NotebookLM streamlines ingestion, visualization, and sharing—turning what used to be a time-consuming slog into an agile, collaborative process.
Efficient multi-format summarization - The webinar demo showed how NotebookLM can ingest CSVs, text notes, PDFs and instantly synthesize them into concise overviews critical for anyone drowning in sensor logs, maintenance reports, and meeting minutes.
Mind maps & interactive summaries - Being able to visualize the relationships between themes like linking temperature spikes to vibration anomalies and having an audio overview to “listen” to the key points will speed up my understanding of complex compressor behavior.
Secure, shareable outputs - I appreciated that enterprise-grade security protects my nonprofit’s sensitive data when uploading to Google Workspace, and that summaries can be exported or shared with colleagues in an interactive format
CU Webinar: Six data collection essentials with Google Sheets & Forms
I chose the “Six Data Collection Essentials with Google Sheets & Forms” webinar because it spotlighted two freely available, user-friendly tools that can immediately elevate data-gathering and analysis capabilities. Delivered by a seasoned instructor, the session balanced clear explanations with hands-on exercises—perfect for anyone already comfortable in Excel who wants to broaden their toolkit without a steep learning curve.
During the workshop, we first dove into Google Sheets fundamentals: building charts and tables on the fly, using smart formatting (like currency styles and dropdown menus), categorizing financial records, and creating dynamic visuals that update as your data changes. We then moved on to Google Forms, where we designed forms from scratch, structured effective surveys, pulled summary statistics automatically, and drilled down into individual responses. By the end, I felt much more confident organizing and visualizing datasets, designing impactful surveys, and interpreting results—skills that will streamline future analytics projects and support faster, data-driven decision making.
