Adelaide University Internship Experience - Olivia Thi Kim Oanh Nguyen
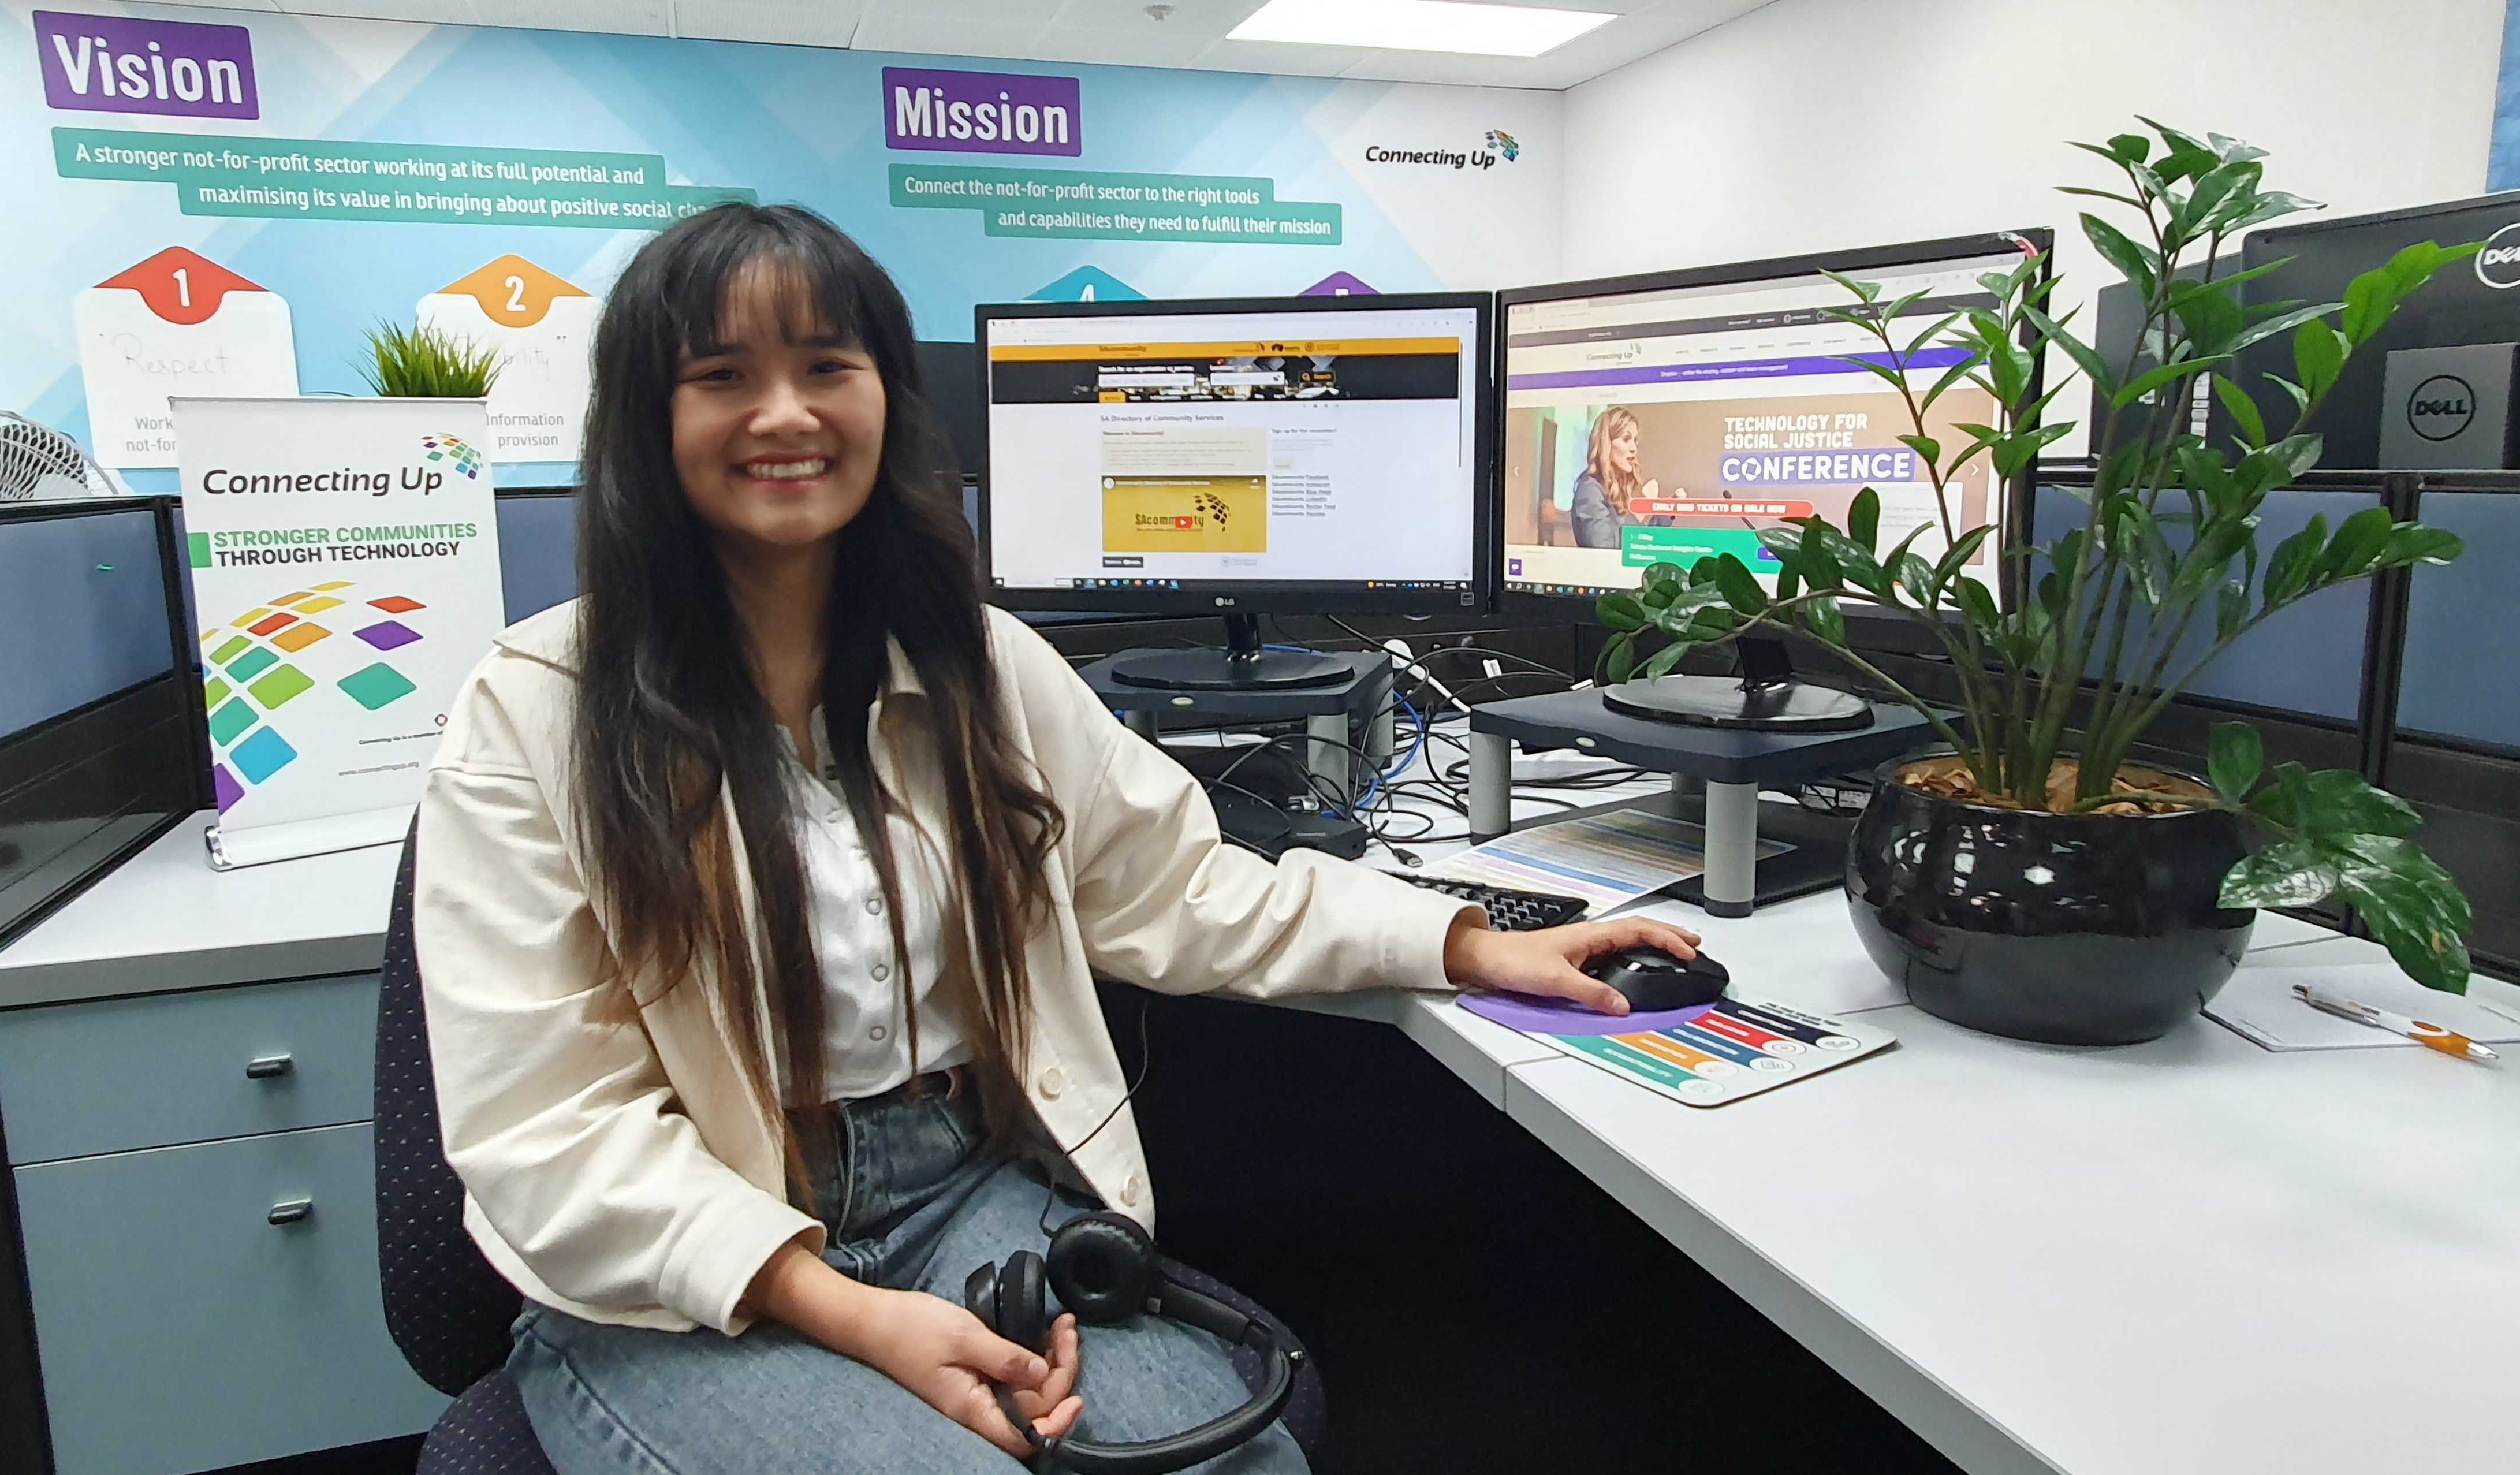
Welcome Olivia!
Olivia Thi Kim Oanh Nguyen joined our SAcommunity Data Analytics Team for her University of Adelaide SET (Sciences, Engineering and Technology) Internship for her Masters of Data Science Trimester 1, 2024: 27 February 2024 - 31 May 2024.
She completed a 280 hour internship onsite with SAcommunity at the Connecting Up Office, Infoxchange for 3 days (22.5 hours) a week for ~14 weeks around her classes.
We were fortunate Olivia decided to re-join the team in a volunteer capacity on the 21 June 2024 immediately after completing her internship to continue exploring Power BI data and investigate SAcommunity website redevelopment. She has also very kindly assisted with inducting and training our new group of Data Analytics Team volunteers and interns who started at the Connecting Up on the 13 August 2024.
We would like to congratulate Olivia on transitioning to a full-time role as a Customer Success Coordinator (including a data role) on the 26 August 2024 at Trellis Technologies a software and technology company that assists organisations achieve their environmental and financial sustainability goals. Well done Olivia!
Total Hours 345 Joined 27 February 2024 Last Check-in 20 August 2024 (retired)

Olivia returning to assist with new internship group 13 August 2024
Personal Biography
Olivia is in her second year of a Master of Data Science at the University of Adelaide 2023-2024. She has a Bachelor of Business and Law from HCMC University of Law 2014, and previously worked as a corporate legal assistant. Here she focussed on commercial contracts and company dispute resolution, whilst running a small business, the Wanfu Trading Service Company, in Vietnam. Aware of the importance of data-driven decision-making for business, Olivia made her career change and moved to Australia, building her knowledge of statistics and machine learning through the curriculum, in big data analysis and machine learning courses.
Currently, she is working on her graduate research project involving predicting the outcomes of tennis matches using the R language, a programming language for statistical computing and data visualisation. This project allows her to enhance her skills in building and enhancing predictive models, combining different predictors to create new useful predictions, and in applying statistical modelling techniques. Her goal for this project is to achieve an 80% accuracy rate in predicting the winners of matches, not only in tennis but also with sports in general.

Image: Intern Olivia Thi Kim Oanh Nguyen's three-year comparison reports
Community Services in Councils Project
Olivia has selected Wattle Range for her Power BI council reports, a database of approximately 120 community services operating in the area for the financial years 2020-2021, 2021-2022 and 2022-2023. Her reports can be found >>here, and Olivia followed up with her council emailing on the 24 May 2024, and contacting by phone 7 June 2024 to ensure her reports were received, following up on the 11 June 2024 for any feedback.
Olivia having returned as a volunteer is also planning to investigate Renmark Paringa Council comparison data, following on from Stathis Avramis and Dexter Tabada's work.
There are a number of steps involved once community service information data presentations are created, a summary of data trends prepared, work is attributed and published to the website, and then will be introduced by Olivia to council stakeholders by phone and email to be used as a tool to understand community needs in their area.
I wanted to collect information about session locations and times and compare three financial years to see where and when people searched for this information most. However, the datasets extracted from the Site Content of Behavior in Google Analytics included only the total number of sessions for each organisation each year. To complete this task, I needed each session's location and time. Anju Odedara suggested using Customization in Google Analytics to build my own datasets. I ended up extracting datasets that included both City and Date simultaneously. However, I faced one issue: I was using the Google Analytics Universal version to extract data before July 2023 and only had data from January 2022 onwards, which meant I only had a complete dataset for one year. I decided to extract more data until December 2023 to have complete data for two years (2022 and 2023) for comparison among years. This made sense for analysing which months of the year had the most clicks. For data from July 2023 to December 2023, I used Google Analytics GA4. Another problem was the limited number of dimensions and metrics I could add to my dataset. Mostafa Didar Mahdi introduced me to Looker Studio, where I could extract datasets with an unlimited number of dimensions and metrics. I could also blend data sources from the Google Analytics Universal version with GA4 without changing the data source every time.
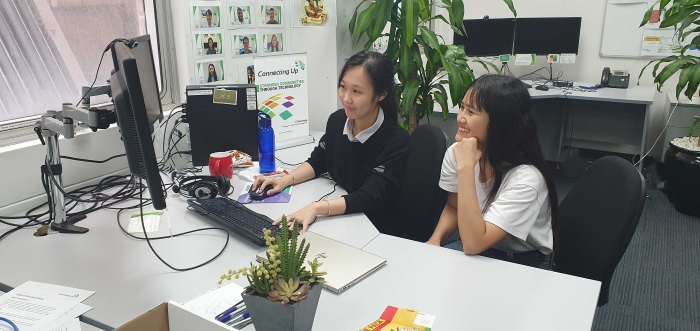

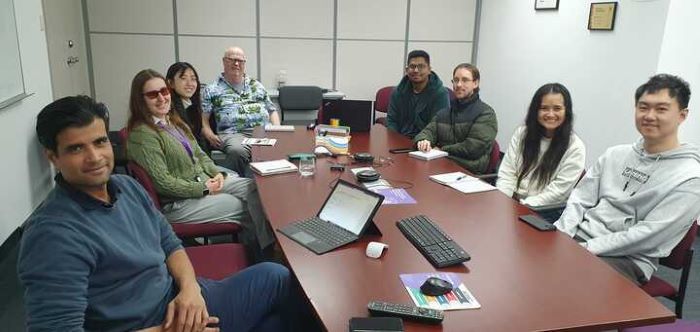 Image: Pankaj Chhalotre, Head of Connecting Up, Samantha Whillas, Customer Experience Officer, Julia Koh, Customer Experience Officer, Volunteer Rex Porter, Intern Mostafa Didar Mahdi, Eric Jenkins, Account Manager, and Interns Olivia Thi Kim Oanh Nguyen, Joe Xuanqiao Zhang in Connecting Up Monthly Staff Meetings
CU Meeting 11 June 2024
Updates from the Connecting Up Team includes monthly highlights, plans, activities
The Connecting Up Team has had a productive month as planned, new partnerships, and impactful internship and volunteer programs with high participation hours. Upcoming plans include a busy event schedule, new initiatives for improving digital literacy in underserved communities, and expanded support services. Our community outreach, enhanced feedback system, and development of new resources are key activities that continue to drive our mission of empowering communities through technology.
27 February 2024
Preparation for effective meetings is essential for ensuring productive outcomes and meaningful participation. It involves thoroughly reviewing relevant materials and information beforehand, familiarizing with the meeting's objectives and agenda, and considering any questions to be raised during the discussion. Written communication emphasizes the importance of being simple and easy to understand, ensuring that the intended purpose and desired actions are clearly articulated. After this talk, these are my key takeaways:
- I must prepare a concise version of my presentation in case of unexpected situations where I may not have enough time to finish as planned. This version should include all main points to ensure understanding.
- When crafting email subjects, I must ensure that they clearly outline the purpose of the email, include specific tasks with due dates if applicable, and contain only essential information for the recipient.
- When receiving emails, it's necessary to delegate tasks when appropriate, promptly address emails upon receipt by either responding immediately or scheduling a follow-up if necessary, and refrain from sending emails over the weekend to respect recipients' personal time.
- I will try to reach the person before cc'ing their manager or cc'ing their other peer in case they are away.
Infoxchange (IX) Community & Cultural Events & Activities
Key topics addressed include autism and employment, diagnosis, NDIS implications, the Disability Royal Commission, national strategy development, and the concept of neurodiversity. These initiatives aim to enhance support, understanding, and acceptance for autistic individuals and promote meaningful change in society.
Thanks to the insights shared during the talk, I am more equipped to access resources and seek guidance from organizations like Amaze, which offer valuable support networks and information. I now know how to support not only people around me but also myself as we navigate the process of receiving a diagnosis of autism and adjusting to the challenges and opportunities it presents.

Infoxchange (IX) Stakeholder Events
During the Q&A session, Amir Aryani emphasized that while data engineers play a crucial role in building pipelines, they may not necessarily possess the expertise in AI technologies. Organizations should focus on developing a clear strategy before integrating AI, ensuring that data is clean and connected, which is a prerequisite for AI technology implementation. Amir clarified that there's no direct trade-off between pre-trained models and RAG.
While fine-tuning models require substantial data and technical resources, pre-trained models can be embedded into RAG, making them inclusive options for various applications. Amir also addressed concerns about the maintenance of RAG models, emphasizing the need for regular updates due to changes in underlying components such as databases and LLMs to avoid software failures and ensure the continued effectiveness of RAG models.
The webinar was delivered by Jim O’Shea Gumbaynggirr man from New South Wales and Chief Operating Officer at VACCHO, Victorian Aboriginal Community Controlled Health Organisation Inc. In this webinar, he outlined principles and frameworks for Indigenous data sovereignty, emphasizing the importance of Indigenous communities having control over the collection, ownership, management, and use of their data.
The CARE principles focus on Collective benefit, Authority to control, Responsibility, and Ethics, emphasizing minimizing harm, maximizing benefit, ensuring justice, and considering future use.
The FAIR principles stress that data should be Findable, Accessible, Interoperable, and Reusable, promoting data usability and accessibility.
In Australia, principles include controlling the data ecosystem, contextual and disaggregated data collection, and ensuring relevance and sustainability. Additionally, practical tips were shared from his discussion with Infoxchange’s staff for preparing data requests to the government.
After this webinar, I understood more about how to protect Indigenous data sovereignty and ensure that Indigenous communities have control over their data. I now understand the importance of principles such as CARE and FAIR in guiding data management practices. Additionally, I have gained practical insights into preparing data requests to the government, which is crucial for Indigenous communities seeking to access government data.
Mentor Meeting 10 May 2024
Connecting Up Volunteers and Interns are provided with the opportunity to select staff members from across the wider Infoxchange organisation for an informational mentor meeting. Here they have the opportunity to ask more about staff members job roles and employment journey, and learn about their career and professional development, to gain insights and guidance that can be applied towards their own success.
Volunteers and interns both prepare 5 questions for their mentors and then are encouraged to record 5 aspects they felt were helpful for them to share on their portfolio for both themselves and other volunteers, and Olivia shared her experience in meeting David Zhao, IT Project Manager, Infoxchange.
David Zhao, IT Project Manager, Infoxchange
David was incredibly friendly and genuine with us. The way he answered our questions reflected the qualities of a good senior and a supportive brother, showing his genuine desire to help us navigate the industry.
Career Preparation
The first question, which Kristen asked about what we need to prepare for getting a job, and I added whether we need to master all skills before landing a job, he emphasized that what companies look for in a candidate is a good attitude and a willingness to study more. He encouraged me to pursue job opportunities and learn the necessary skills along the way, even if I am not an expert in them initially. He never regretted not studying IT initially; his background in civil engineering has given him a broader perspective on work and decision-making.
Skills for Advancement
Regarding the second question about skills for advancement, David's career progression from associate consultant to junior consultant, and then to senior consultant in just three years, left me with the greatest impression. He highlighted the importance of planning for the skills, tasks, and objectives required for a higher position, and then acquiring the necessary skills to fulfill these requirements. He emphasized the importance of being proactive in seeking out new projects and demonstrating the ability to handle tasks and overcome challenges. He mentioned that he moved to a new company to expose himself to a variety of skills, areas, and tasks, emphasizing the importance of continuous learning and self-improvement.
Project Experience & Lessons Learned
For the third question about project experience and lessons learned, when I believe I learn better from mistakes. He emphasized the importance of not repeatedly asking the same questions, checking all information and necessary resources before seeking assistance, and setting boundaries for workload to avoid overwhelming oneself. He stressed the need to understand my limitations and avoid taking on tasks that exceed my capacity.
Collaboration & Networking
When asked about collaboration and networking, David advised that while fostering personal friendships with colleagues is beneficial, it should not be forced. He ensured colleagues are individuals who can provide job references and introductions to desired tasks or positions.
Career Paths
Finally, when asked for career path advice, David emphasized the importance of staying updated with the job market trends. He advised regularly assessing the job market to identify positions in demand and aligning my career path accordingly.
 Image: Intern Olivia Thi Kim Oanh Nguyen watched one of the recorded webinars with Intern Mostafa Didar Mahdi and Volunteer Stathis Avramis
Digital Training & Development
Volunteers and interns have access to the Connecting Up Digital Learning Platform providing live webinars and recorded webinars, workshops and webcons presented by subject-matter experts to understand more about a range of technology topics for the not-for-profit sector.
Relevant training sessions were selected, attended, summarised and assessed by Olivia to look at how these sessions can enhance her internship experience have included:
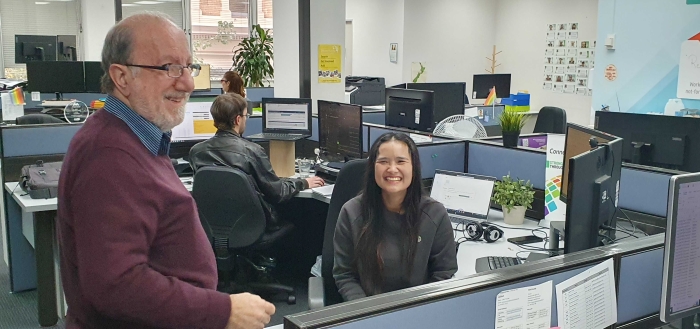 Image: Volunteer Stathis Avramis, Data Analytics Team Lead explained to Intern Olivia Thi Kim Oanh Nguyen how to use Google Analytics GA4 and its additional benefits on 22 May 2024
Data Readiness
Volunteers and interns have the opportunity to learn from useful recorded seminars. One such seminar is the Data Readiness, which is delivered by Sam Headberry, who has 12 years of professional experience working in some of Australia's largest housing and homelessness organizations in Australia. Sam is passionate about data and using information technology to boost outcomes in the non-profit sector.
During his seminar, he emphasized that organizations must prioritize robust data management strategies that enable effective decision-making through data. This involves understanding the organization's information architecture, data flows, and context - utilizing structured formats, identifying relationships between datasets, and recognizing why data is collected. It requires addressing challenges around disparate data storage systems and types by reducing sources, integrating data, and leveraging visualizations.
He also discussed that organizations should centralize data sources, limiting the number of systems, and carefully select appropriate systems with stakeholder input to meet their needs. Olivia has shared her key takeaways from the seminar below. My key takeaways were:
- When good data goes in, we have great insights out, reminding me to know the reasons and the goals I want to collect this information.
- Data is meaningful only when in context. When collecting and analyzing data, I must know the relationships of these datasets and how they connect to my problem statement and the organization's background and available resources.
- Centralizing the data sources helps eliminate redundancies, improves data quality, and allows for more integrated analysis by bringing disparate data together into a unified system or platform.
A Practical Introduction to Power BI
Another recording seminar that Olivia watched was the A Practical Introduction to Power BI webinar delivered by Marcus Harvey, who leads Infoxchange's IT consulting and services teams in Australia and New Zealand. He and his team are enthusiastic about assisting organizations in leveraging technology to operate more efficiently, aiming for tangible results for their clients and the communities they serve.
During his seminar, he discussed that effective data management and analysis require integrating disparate data sources into a unified view, understanding dataset context and relationships, and enabling collaborative sharing of insights within the organization. A data-driven approach helps identify trends, improvement areas, and resource optimization based on client demographics, outcomes, and funder targets.
However, he also showed that this necessitates addressing data quality issues, securing organizational commitment with dedicated resources, and taking a strategic approach guided by specific questions or hypotheses. Olivia has shared her key takeaways from the seminar below. My key takeaways were:
- Power BI enables integrating data from multiple sources for comprehensive analysis and insights with a uniform view of all filters. With Power BI, I can refresh and connect different data sources. I can also make my own queries and share insights within the organization through collaborative sites and track outcomes activity.
- It's crucial to understand the context, meaning, and relationships within datasets to derive valuable insights. I need to be careful with errors in data when it gives results that cannot be trusted. In this case, it is better to fix the solution at the source when the information is entered in the first place.
- Instead of spending a lot of time wandering, it is best to start with a specific hypothesis or question and build a report or dashboard to answer these questions using charts, graphs, and filters.
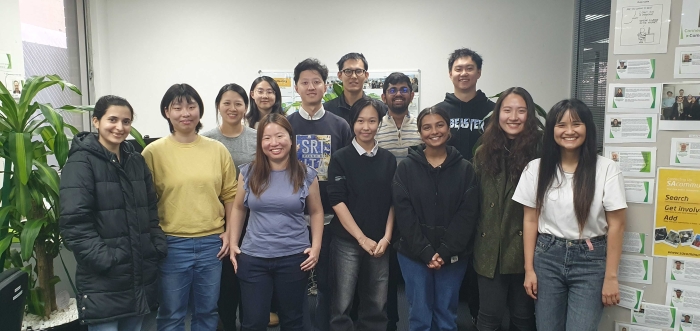 Image: Adelaide University Internships, including Interns Anju Odedara, Yi Han, Kristen Ngoc Khanh Mai Nguyen, Jay Shijie Zhang, Harsh Bhatt, Tanvi Srivastava, Joe Xuanqiao Zhang, Sylvia Shiwen Cao, Olivia Thi Kim Oanh Nguyen and Industry Project Groups, including Violet Zewei You, Jamie Jiemin Zhang, Yong Kheng Beh, Clover Xinyue Luo
My Internship Experience
I am incredibly proud to be an intern in the Data Analytics team at Connecting Up, where I have learned invaluable lessons in data collection, data cleaning and quality, data visualization, storytelling with data, and personal branding. I would like to sincerely thank my team members for their tremendous support during my internship.
First, I want to thank my supervisor, Catherine Mcintyre, who has helped me realise the importance of personal branding and networking. Building a good online portfolio with photos and explanations of my activities and work is essential for self-promotion. When people search my name on Google, they can easily find my photos and work. Connecting with people through webinars and having an elevator speech to introduce myself and my work is crucial for other interns, volunteers, and staff to get to know me better and build a network.
I also learned a lot from Volunteer Stathis Avramis, Data Analytics Team Lead, about the new version of Google Analytics. I now understand the differences between Universal Analytics and GA4 and know how to extract suitable datasets for specific analyses. Building reports using Google Analytics and Looker Studio, as introduced by Mostafa Didar Madhi and Stathis, has provided me with a new experience in creating plots and graphs based on automatically updated data, without the need to upload and refresh every time as we do with Power BI. Additionally, I have gained a deeper understanding of popular terms such as bounce rate, new user/returning user, average session duration, views per session, and views per user.
Kristen Ngoc Khanh Mai Nguyen, with her expertise in Excel, helped me become proficient in using the "Text to Columns" feature to split data, a more efficient method than using functions. She also taught me to use XLOOKUP to exclude combined data from another council and conditional formatting to handle different names of the same organization over the years.
Last but not least, the Python scripts built by Pujan Maharjan, Violet Zewei You, and Harsh Bhatt have greatly assisted me in practicing my API skills.
Overall, this internship has been a transformative experience, and I am looking forward to returning in a new role as a volunteer for more interesting and helpful projects.

Image: Pankaj Chhalotre, Head of Connecting Up, said a few words and gave gifts to interns who have completed their internships, including Interns Harsh Bhatt, Mostafa Didar Mahdi, Olivia Thi Kim Oanh Nguyen, Anju Odedara, Kristen Ngoc Khanh Mai Nguyen, Sylvia Shiwen Cao, Clover Xinyue Luo, Violet Zewei You, Jamie Jiemin Zhang, Yong Kheng Beh, Yi Han, and Tanvi Srivastava
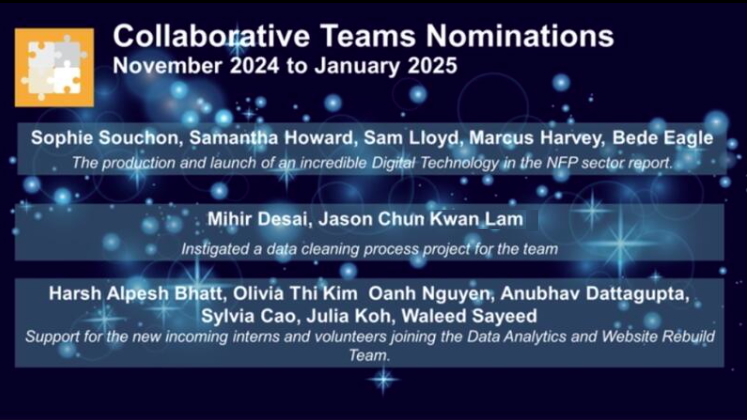
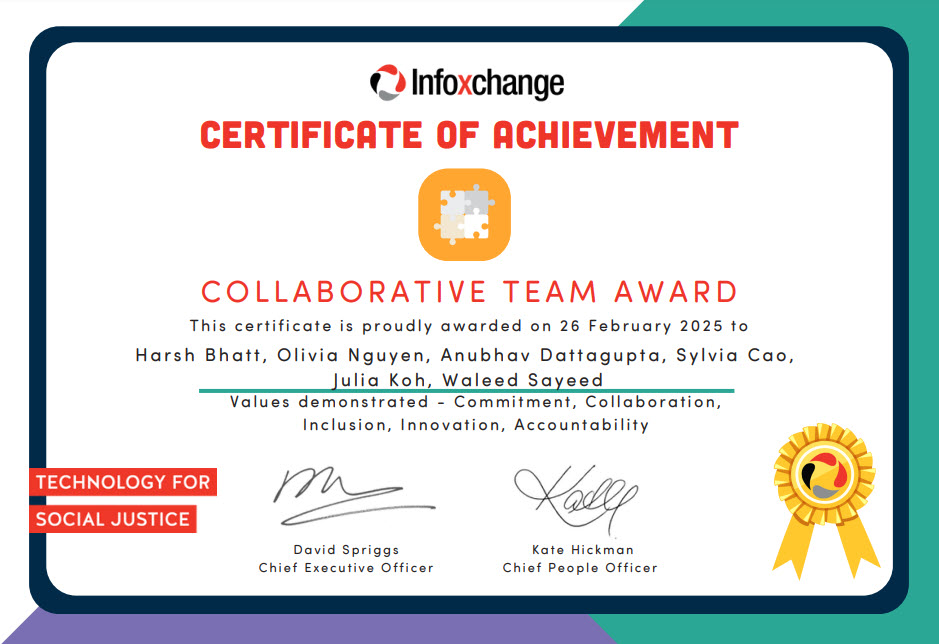
Oivia was nominated for the Collaborative Team Award for her contribution as a volunteer to assist and induct new volunteers and interns over June, July & August 2024 - Thank you Olivia
Sign up for the newsletter!
Subscribe to our monthly newsletter to receive news, information and events for the community sector in SA.


