![]()
![]()
![]()
My Volunteer Experience - Van Lam Nguyen

Welcome Lam!
Van Lam Nguyen joined the SAcommunity Data Analytics Team as a volunteer on 14 August 2024.
Total Hours 199 This Year 17 Joined 14 August 2024 Last Check-in 7 April 2026
Personal Biography
Van Lam Nguyen has a background in biological science, working as a lecturer at Vietnam National University of Agriculture (VNUA) from 2003 to 2019. He graduated MSc in Biotechnology and PhD in Plant Physiology and Biochemistry from Flinders University. Where he has been working at Flinders University as a Research staff member since 2019.Lam has experience in designing and conducting experiments, performing statistical analyses, and writing manuscripts for publication.
Lam joined the SAcommunity Team because of his interest in data analysis, and his aim to learn and gain more experience in the area and connect with other people in this field. He plans to use his knowledge and experience to contribute to the organisation, whilst looking for a future career in Data Analytics and then Data Science.
Community Services in Councils Project
Lam has selected the Naracoorte Lucindale Council for his Power Bi and Canva reports, a database of about 64 community services operating in the area for the financial year 2024-2025. These reports will be added to the council statistics webpage >>here and can currently be seen here.
There are a number of step involved in creating the reports of community service information. Once the data are collected, the summary trends of the data are prepared. The reports are then checked by the supervisor before being published to the website and iintroduced by Lam to Naracoorte Lucindale council stakeholders for information and feedback.
Power BI Six Year Comparison Reports
After discussing with my supervisor, Catherine Mcintyre, about creating Power BI Year Comparison dashboards, I decided to create five year comparison reports to capture the changes in Sessions as well as New Users in five recent years. I had a look at Year Comparison Reports created by Olivia Thi Kim Oanh Nguyen and Harsh Bhatt. Both of their reports are great. Harsh’s reports are clear and detailed and Olivia’s reports include Geographical Visualisation. I am interested in the Geographical Visualisation Report, so I adapted Olivia’s template for my reports.
Several steps have been done to build these reports. First, I collected data from four previous years (2019-2023) stored in the database of Data Analytics Team, SAcommunity and downloaded and cleaned the data of the year 2023-2025. I then developed Python code to merge the data of five years and create full addresses for organisations to build geographical reports. Finally, the merged data and address data are used to create Five Year Comparison Reports and Geographic Visualisation Reports. These reports will be added to the council statistics webpage >>here and can currently be seen here
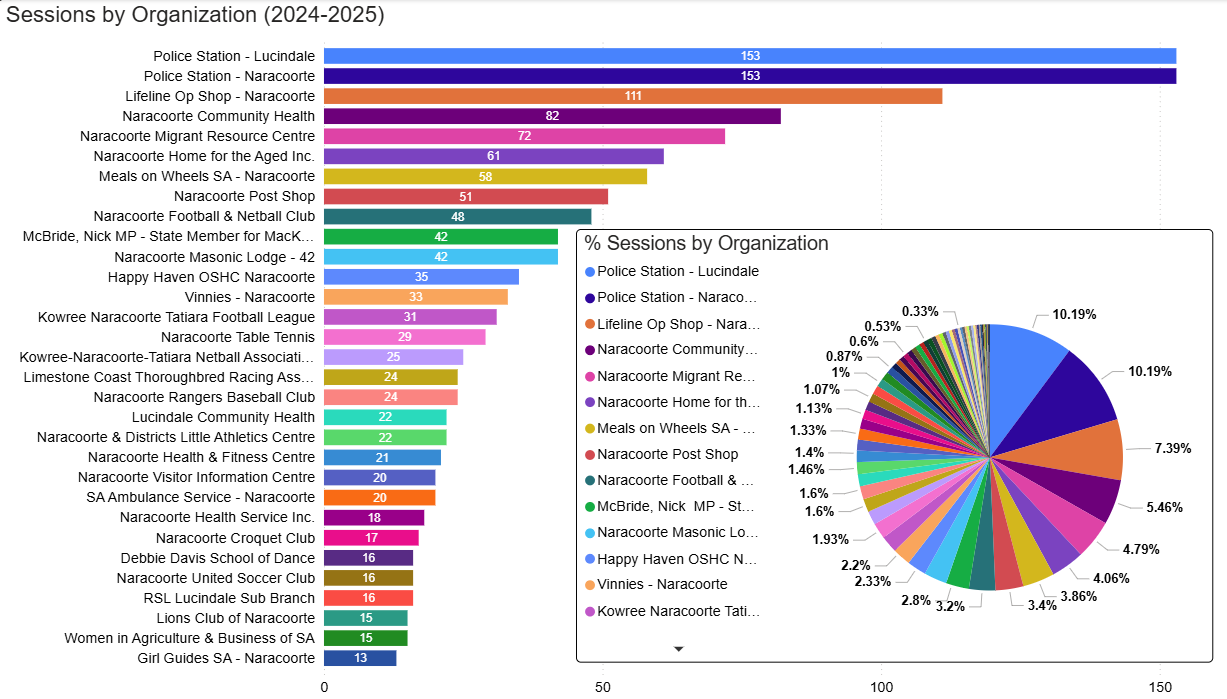
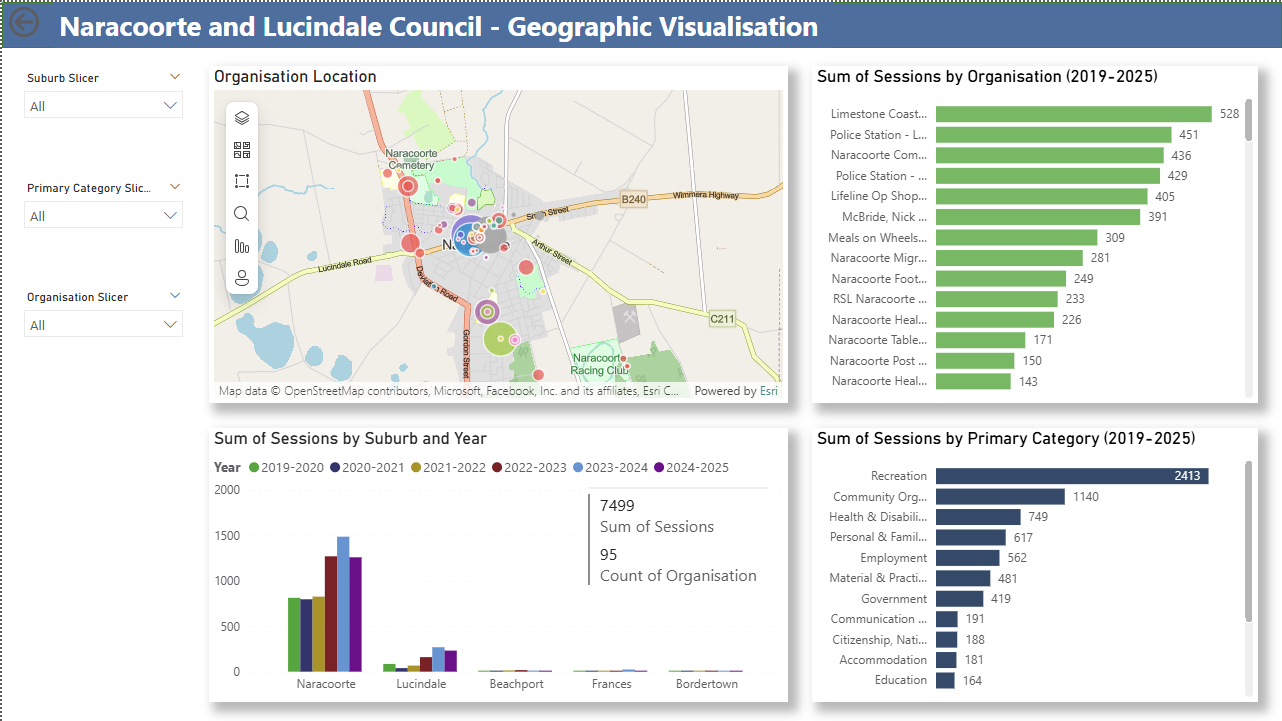
The reports includes three Dashboards, Geographic Visualisation, Sessions Trends and New User Trends. The Geographic Visualisation is combined with three graphs, Sum of Sessions by Suburb and Years, Sum of Session by Organisation and Sum of Sessions by Primary Category. Thus, this Dashboard can quickly locate the locations and also provides general Sessions Trend in Suburb and in each year. We also can view the Session Trends by Organisation and Primary in overall five years.
The Session Trends Dashboard provides more insight into session trends, including Session Trends by Primary Category and Year, Session Trends by Organisation and Year, Sum of Session by Organisation and Year. This Dashboard also includes the information of Top 3 Organisations. The New Users Trends Dashboard presents the correlation and comparison between the Sum of New Users and the Sum of Sessions. It also provides New User Trends by Primary Category and Year and New User Trends by Organisation and Year.
To ensure my reports were clear and concise so that general audiences could easily understand them, I checked with my supervisor, Catherine Mcintyre, in the role of a general audience, to ensure she understood the visualisations and insights. After checking, I got her recommendation to include years (2019-2025) in the titles of The Sum of Sessions by Organisation and The Sum of Sessions by Category charts to make it clearer.
Training and Development - Google Analytics and Telephone Techiniques
Volunteers and interns are trained to use Google Analytics to target and filter data of selected council. Once collected, the data are cleaned and then combined with the data from SA community.
Checking the information of services in the council area is important before reports are published and it is a step of data cleaning. Thus, volunteers and interns are trained to have proper Telephone Techniques to reach community services and check their details are correct adn accurate.
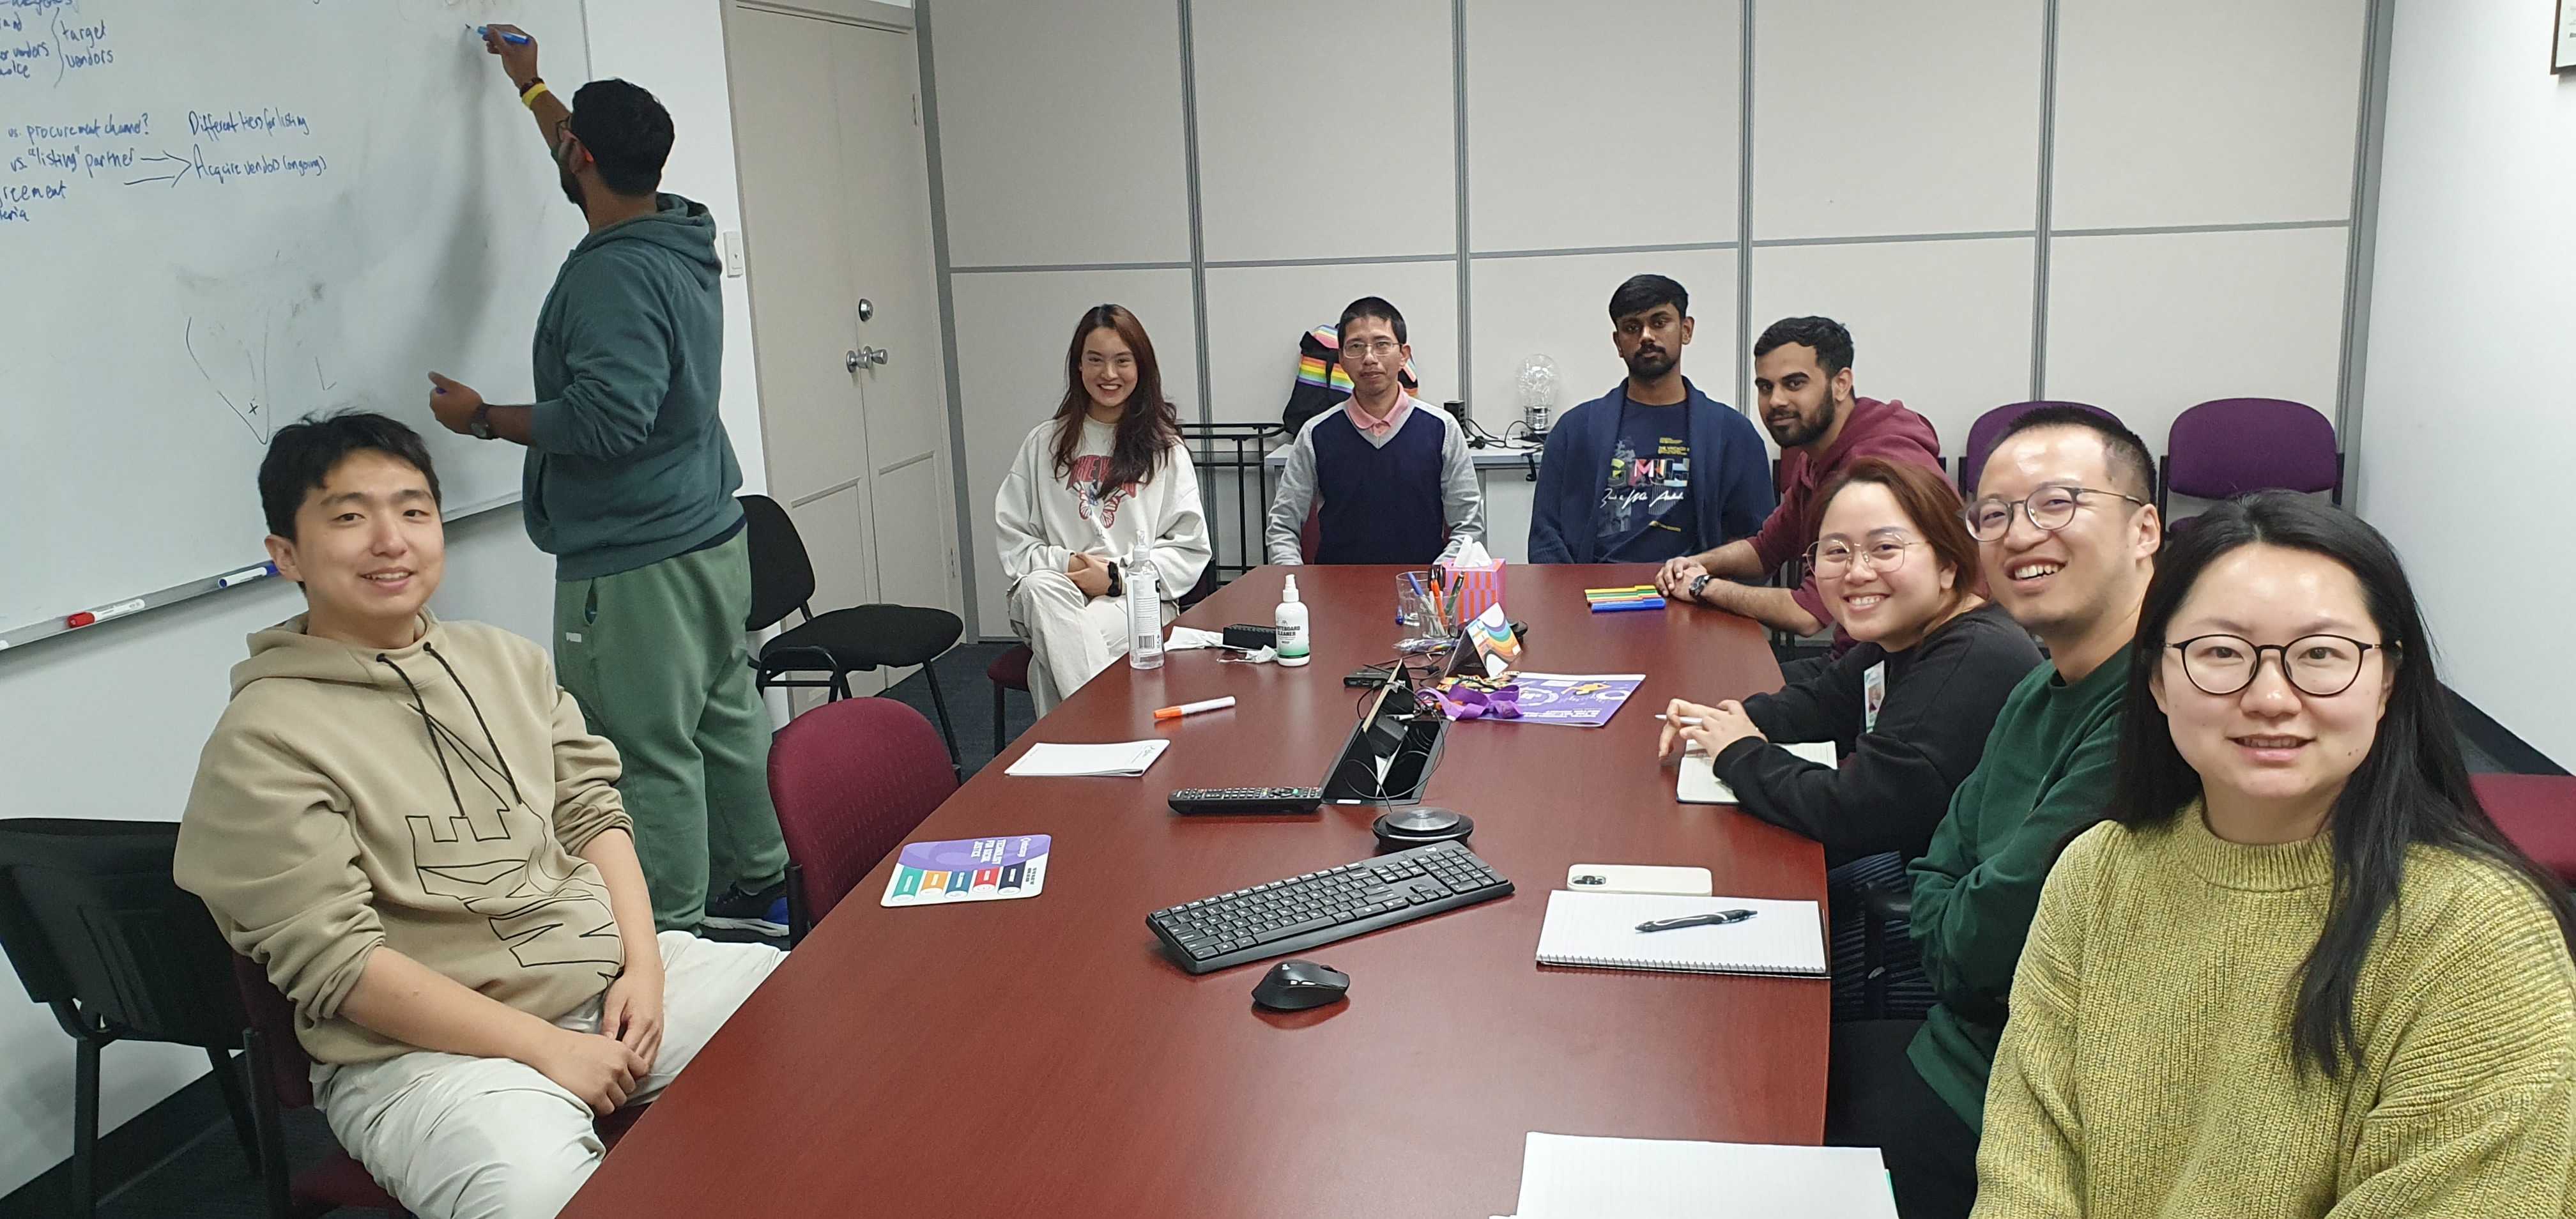
Working through the Google Analytics Challenges with the Data Analytics Team. Anubhav Dattagupta shares how to download and clean data with Volunteers, Van Lam Nguyen, Todd Guanhua Tao , Ivy Ling Luo, Aaron Xuefeng Li, Mihir Desai, Alex Thi Ngoc-Bich Nguyen.
Data Analytics Team meeting
The Data Analytical Team has a meeting about how to organise files to support volunteers and interns better. The meeting also discussed how to enable Obsidian for the Data Analytical Team to access. This will support the use of markdown and export results in different file types.
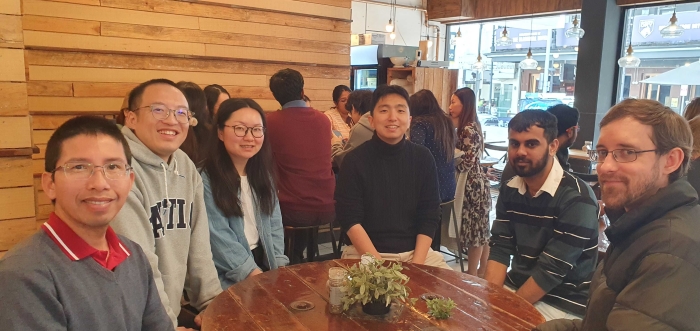
Connecting Up Team Coffee: Staff, Volunteers and Interns catch up
Volunteer Lam with Interns Todd Guanhua Tao , Ivy Ling Luo, Aaron Xuefeng Li, Mihir Desai, Connecting Up Staff Member Eric Jenkins, Account Manager

Digital Training Webinars
Volunteers and interns have access to the Connecting Up Digital Learning Platform providing live webinars and recorded webinars, workshops and webcons presented by subject-matter experts to understand more about a range of technology topics for the not-for-profit sector.
Webinar - Data storytelling principles: Narrative beyond numbers
Webinars are a great source to learn Data Analytics. Data storytelling is an important technique when you want to engage the audience with your report. This webinar provides us with four steps to create great data storytelling: 1. Identify, 2. Simplify, 3. Visualise and 4. Humanise. In the first step, the main points need to be identified. Suitable language is used to make sure that all the audience can understand. Suitable visualisation methods such as line graph, bar chart or pie chart are selected and your real life stories should be shared to make the audience feel something.
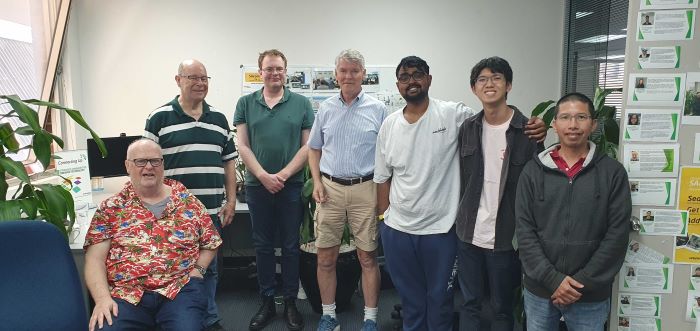 SAcommunity Wednesday Team 11 December 2024
Volunteers: Rex Porter, David Webb, Alexander Bull, Chris Baldwin, Anubhav Dattagupta, Jason Chun Kwan Lam and Van Lam Nguyen
Update organisations and re-organise organise organisation in suitable categories (12 Feb 2025)
When working on the data of Naracoorte Lucindale Council, although some organiations exist including Naracoorte RSL Bowling Club, Naracoorte South Primary School and Country Fire Service, they were not listed in the data. Therefore, they have been updated in the SAcommunity. The sessions have been checked using Googole Analytics and included in the report.
Few organisations have been re-organsied into the suitable primary categories. For example, Naracoorte Migrant Resource Centre from Finance, Income, Business has been moved to citizenship and Nationality and Naracoorte Visitor Information Centre has been moved to Community and Information Services.
Preparing Data for a Five-Year Comparison Using Python – Naracoorte Lucindale Council (28 May 2025)
Comparing sessions across years helps assess whether an organisation’s online presence is growing or declining over time. To support this analysis, I developed Python scripts to merge and clean session data from five financial years (2019–2020 to 2023–2024). Additionally, I wrote code to extract suburb and address information for all five years to enable geographic visualization using Google Charts.
Using Python for data preparation is an efficient and scalable approach, particularly when integrating with Power BI for visual comparisons. These scripts are also adaptable for use with other councils.
